Full Report
The numbers behind PT Grahaprima Suksesmandiri Tbk: as-reported financial statements and company metrics for FY2022–FY2025, traced to the source filings, opened with the share-price history those statements have to justify. Every linked figure opens the exact page of the filing it was printed on, with the statement row highlighted. Amounts in Rp million unless noted.
Reading notes: Reporting currency is the Indonesian Rupiah. All figures are shown in millions of Rupiah (Rp million); the audited statements are printed in full Rupiah, so each cited figure's anchor is the full-Rupiah amount as printed while the displayed value is that amount in millions. Per-share figures are in Rupiah per share as printed (Indonesian decimal comma converted to a point). Main columns FY2022–FY2025 are all sourced to the audited consolidated statements. FY2025 its FY2024 comparative come from the FY2025 Annual Report; FY2024 from the FY2024 Annual Report; FY2023 from the FY2023 Annual Report; FY2022 from the comparative column of the FY2023 Annual Report. The company's income/cash-flow data feed was empty this run (data/financials had only balance_sheet.json and segment.json); the income statement, cash-flow statement and revenue breakdown were extracted directly from the audited filings. Revenue breakdown uses Note 24/23 (external revenue disaggregated by service line: transportation services vs. body-building/Karoseri, split third-party vs. related-party). Body-building (Karoseri) external revenue began in FY2024.
Share Price — Available History Since February 2026
The stock closed at IDR 242.00 on Jul 31, 2026 — down 31% over the window shown, trading between IDR 161.00 and IDR 378.00.
Source: market price feed, daily closes, Feb 2026–Jul 2026 — the feed marks this available history as partial. Price return only, excludes dividends.
FY2025 at a Glance
Revenue (Rp million)
Net income (Rp million)
Source: FY2025 consolidated statements [1] [2] [3]. Click any linked figure to open the filing page with the row highlighted.
Revenue by Service Line
| Revenue by Service Line | FY2022 | FY2023 | FY2024 | FY2025 |
|---|---|---|---|---|
| Transportation services — third parties | 214,560 | 343,641 | 402,537 | 570,584 |
| Transportation services — related parties | 1,316 | 1,275 | 3,669 | 14,457 |
| Body builder (Karoseri) — third parties | — | — | 11,461 | 71,264 |
| Body builder (Karoseri) — related parties | — | — | 11,261 | — |
| Total revenue | 215,876 | 344,917 | 428,929 | 656,305 |
| Total revenue growth, derived | — | +59.8% | +24.4% | +53.0% |
Source: Note 24/23 Revenues — consolidated revenue disaggregated by service to customers (transportation vs. body-building), third-party vs. related-party [4] [5] [6]. Click any linked figure to open the filing page with the row highlighted.
Income Statement
Source: Consolidated Statement of Profit or Loss and Other Comprehensive Income; FY2022 is the comparative column of the FY2023 annual report [1] [2] [3]. Click any linked figure to open the filing page with the row highlighted.
Balance Sheet
| Balance Sheet | FY2022 | FY2023 | FY2024 | FY2025 |
|---|---|---|---|---|
| Cash and cash equivalents | 8,760 | 16,057 | 8,528 | 19,696 |
| Trade receivables — third parties | 44,192 | 84,236 | 149,661 | 175,999 |
| Total current assets | 73,761 | 121,177 | 193,749 | 285,904 |
| Fixed assets — net | 541,989 | 716,111 | 795,448 | 956,116 |
| Total assets | 684,826 | 941,311 | 989,890 | 1,242,805 |
| Total current liabilities | 117,092 | 121,186 | 164,098 | 174,976 |
| Bank loans — non-current | 35,495 | 107,157 | 87,755 | 170,931 |
| Consumer financing payables — non-current | 304,495 | 274,090 | 198,954 | 222,273 |
| Musyarakah financing — non-current | 10,408 | 123,126 | 168,781 | 221,505 |
| Total liabilities | 488,840 | 659,150 | 669,483 | 856,251 |
| Total equity | 195,986 | 282,161 | 320,407 | 386,554 |
Source: Consolidated Statement of Financial Position; FY2022 is the comparative column of the FY2023 annual report [1] [7] [8] [2]. Click any linked figure to open the filing page with the row highlighted.
Cash Flow
| Cash Flow | FY2022 | FY2023 | FY2024 | FY2025 |
|---|---|---|---|---|
| Net cash provided by operating activities | 27,606 | 59,574 | 33,901 | 92,912 |
| Proceeds from disposal of fixed assets | 333 | 3,911 | 26,119 | 97,095 |
| Acquisition of fixed assets | (2,458) | (106,159) | (37,544) | (60,531) |
| Net cash used in investing activities | (45,000) | (209,634) | (13,093) | 13,125 |
| Net cash provided by (used in) financing activities | 8,921 | 200,079 | (28,336) | (107,613) |
| Net increase (decrease) in cash and cash equivalents | (8,472) | 50,019 | (7,529) | (1,576) |
Source: Consolidated Statement of Cash Flows (direct method); FY2022 is the comparative column of the FY2023 annual report. FY2024 financing and net-change figures are cited to the comparative column of the FY2025 annual report. [9] [10] [11] [12]. Click any linked figure to open the filing page with the row highlighted.
Fleet Cost Structure (Land-Transport Cost of Revenue)
| Fleet Cost Structure (Land-Transport Cost of Revenue) | FY2022 | FY2023 | FY2024 | FY2025 |
|---|---|---|---|---|
| Haulage / transportation expense | 68,540 | 116,328 | 163,774 | 296,917 |
| Fleet depreciation | 24,735 | 33,447 | 33,185 | 40,391 |
| Spare parts maintenance | 2,905 | 8,778 | 9,548 | 18,593 |
| Tires | 11,318 | 7,550 | 6,064 | 10,154 |
| Insurance licensing | 9,118 | 10,207 | 10,451 | 10,000 |
Source: company filings [4] [5] [13]. Click any linked figure to open the filing page with the row highlighted.
Segment Body-Building (Karoseri) Economics
| Segment Body-Building (Karoseri) Economics | FY2022 | FY2023 | FY2024 | FY2025 |
|---|---|---|---|---|
| Land Transportation — segment profit | — | — | 179,584 | 204,121 |
| Karoseri (Body Builder) — segment profit | — | — | 1,857 | — |
| Karoseri — cost of goods manufactured | — | — | 12,516 | 35,520 |
| Karoseri — raw supporting materials used | — | — | 8,759 | 29,393 |
| Karoseri — direct labor | — | — | 3,499 | 5,226 |
| Karoseri — purchases of finished goods | — | — | 8,350 | 16,700 |
Source: company filings [14] [15] [16]. Click any linked figure to open the filing page with the row highlighted.
Workforce Sourcing
| Workforce Sourcing | FY2022 | FY2023 | FY2024 | FY2025 |
|---|---|---|---|---|
| Total employees | — | 184 | 236 | 305 |
| Permanent employees | — | 149 | 144 | 150 |
| Non-permanent employees | — | 35 | 92 | 155 |
| Related-party purchases (% of consolidated cost of revenue) | — | — | 8.5% | 38.0% |
Source: company filings [16] [17]. Click any linked figure to open the filing page with the row highlighted.
Long-Term Record
| Fiscal year | Total revenue | Gross profit | Net profit | Net cash from operating activities | Total equity | Basic earnings per share |
|---|---|---|---|---|---|---|
| FY2021 | 147,187 | 71,001 | 7,788 | — | 95,615 | — |
| FY2022 | 215,876 | 99,060 | 15,834 | 27,606 | 195,986 | 12.07 |
| FY2023 | 344,917 | 157,796 | 33,432 | 59,574 | 282,161 | 18.54 |
| FY2024 | 428,929 | 181,441 | 39,477 | 33,901 | 320,407 | 20.81 |
| FY2025 | 656,305 | 224,320 | 69,277 | 92,912 | 386,554 | 36.48 |
Source: consolidated statements across filings; older years from the standardized feed [9] [1] [18]. Click any linked figure to open the filing page with the row highlighted.
Analyst Consensus
Mean target
Street ratings: No sell-side analyst coverage. PT Grahaprima Suksesmandiri Tbk (GTRA, IDX) is covered by 0 analysts — no consensus price target and no buy/hold/sell ratings are published on any aggregator (Simply Wall St, stockanalysis.com, Yahoo Finance all show n/a). The only forward figure available is management's own FY2025 revenue guidance of ~Rp 500 billion (~+16.5% YoY), which is company guidance, not an analyst estimate.
Estimate source: analyst consensus (claude_web), as of 2026-08-01. Forecasts carry no filing page links.
Traceability
207 of 225 figures on this page (92%) link to the filing page where they are printed — click a linked figure to open the source PDF at that page with the row highlighted. Unlinked figures come from standardized data feeds or pre-filing years.
Reporting currency is the Indonesian Rupiah. All figures are shown in millions of Rupiah (Rp million); the audited statements are printed in full Rupiah, so each cited figure's anchor is the full-Rupiah amount as printed while the displayed value is that amount in millions. Per-share figures are in Rupiah per share as printed (Indonesian decimal comma converted to a point).
Main columns FY2022–FY2025 are all sourced to the audited consolidated statements. FY2025 its FY2024 comparative come from the FY2025 Annual Report; FY2024 from the FY2024 Annual Report; FY2023 from the FY2023 Annual Report; FY2022 from the comparative column of the FY2023 Annual Report.
The company's income/cash-flow data feed was empty this run (data/financials had only balance_sheet.json and segment.json); the income statement, cash-flow statement and revenue breakdown were extracted directly from the audited filings.
Revenue breakdown uses Note 24/23 (external revenue disaggregated by service line: transportation services vs. body-building/Karoseri, split third-party vs. related-party). Body-building (Karoseri) external revenue began in FY2024.
FY2021 long-term figures are from the Financial Performance Highlights table (in millions of Rupiah) in the FY2023 Annual Report (marked '2021*' by the company); FY2020 and earlier are not disclosed in the corpus.
GTRA's capital structure is dominated by asset-financing debt for its truck fleet — bank loans, consumer-financing payables, and Islamic musyarakah financing — shown as separate non-current lines on the balance sheet.
Quarterly income-statement single quarters are derived from the printed year-to-date interim statements; the FY2025 corpus contains interims through Q3 (9M), so Q4 FY25 is derived from the full-year audited total minus the 9-month YTD.
3 figure(s) differed between the data feed and the filing; the filing value is shown (see the run's metrics/metrics_tab.json for the audit trail).
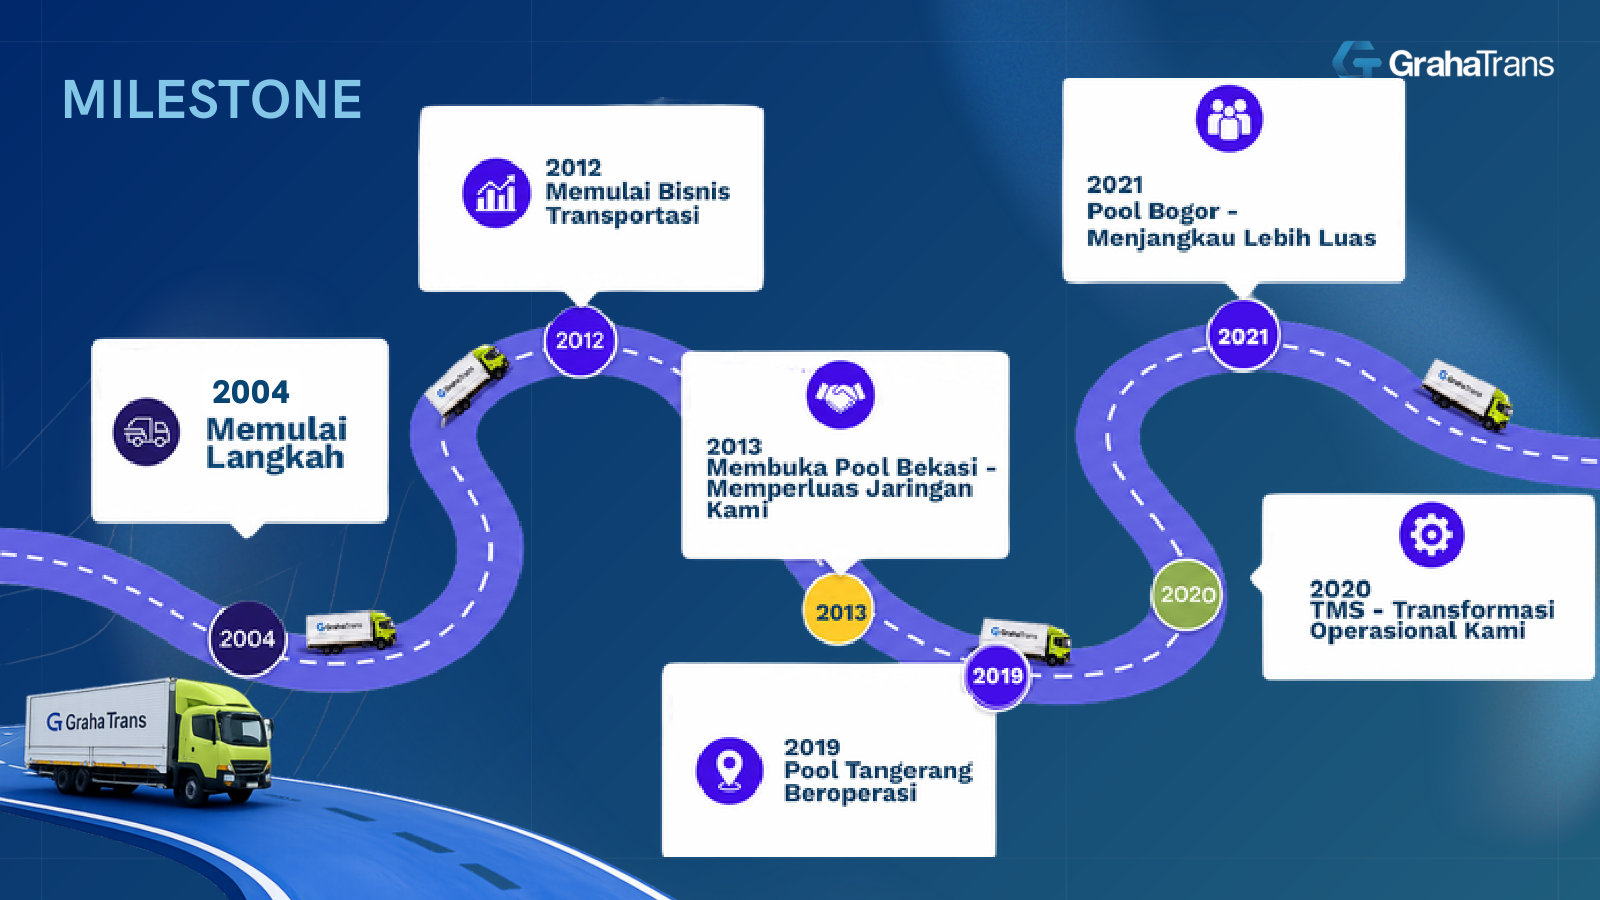
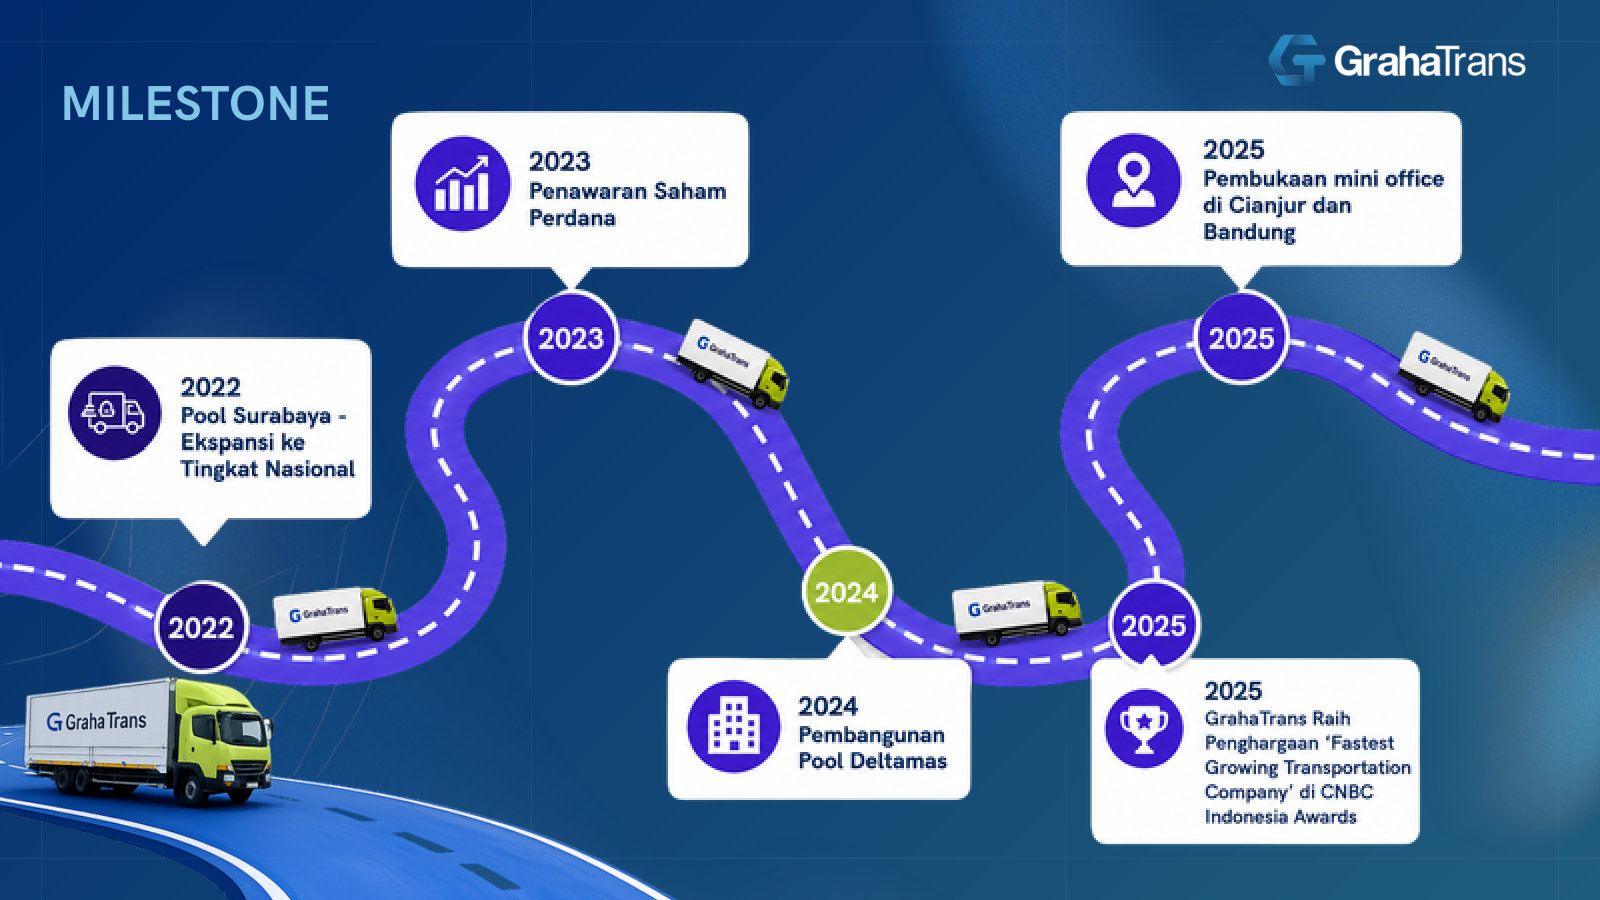
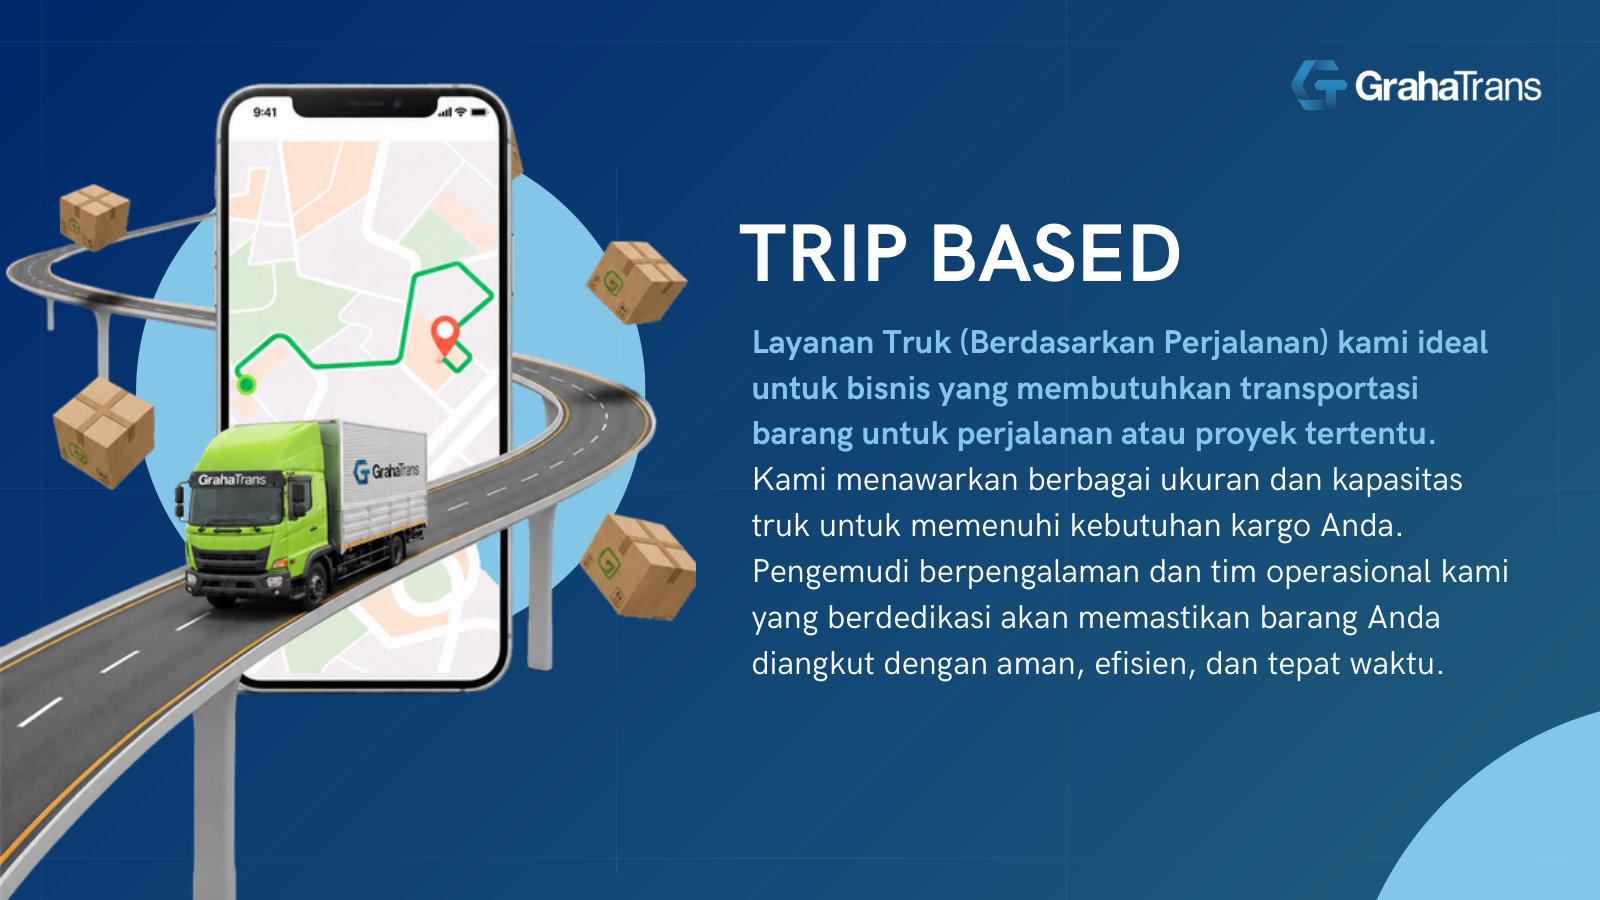
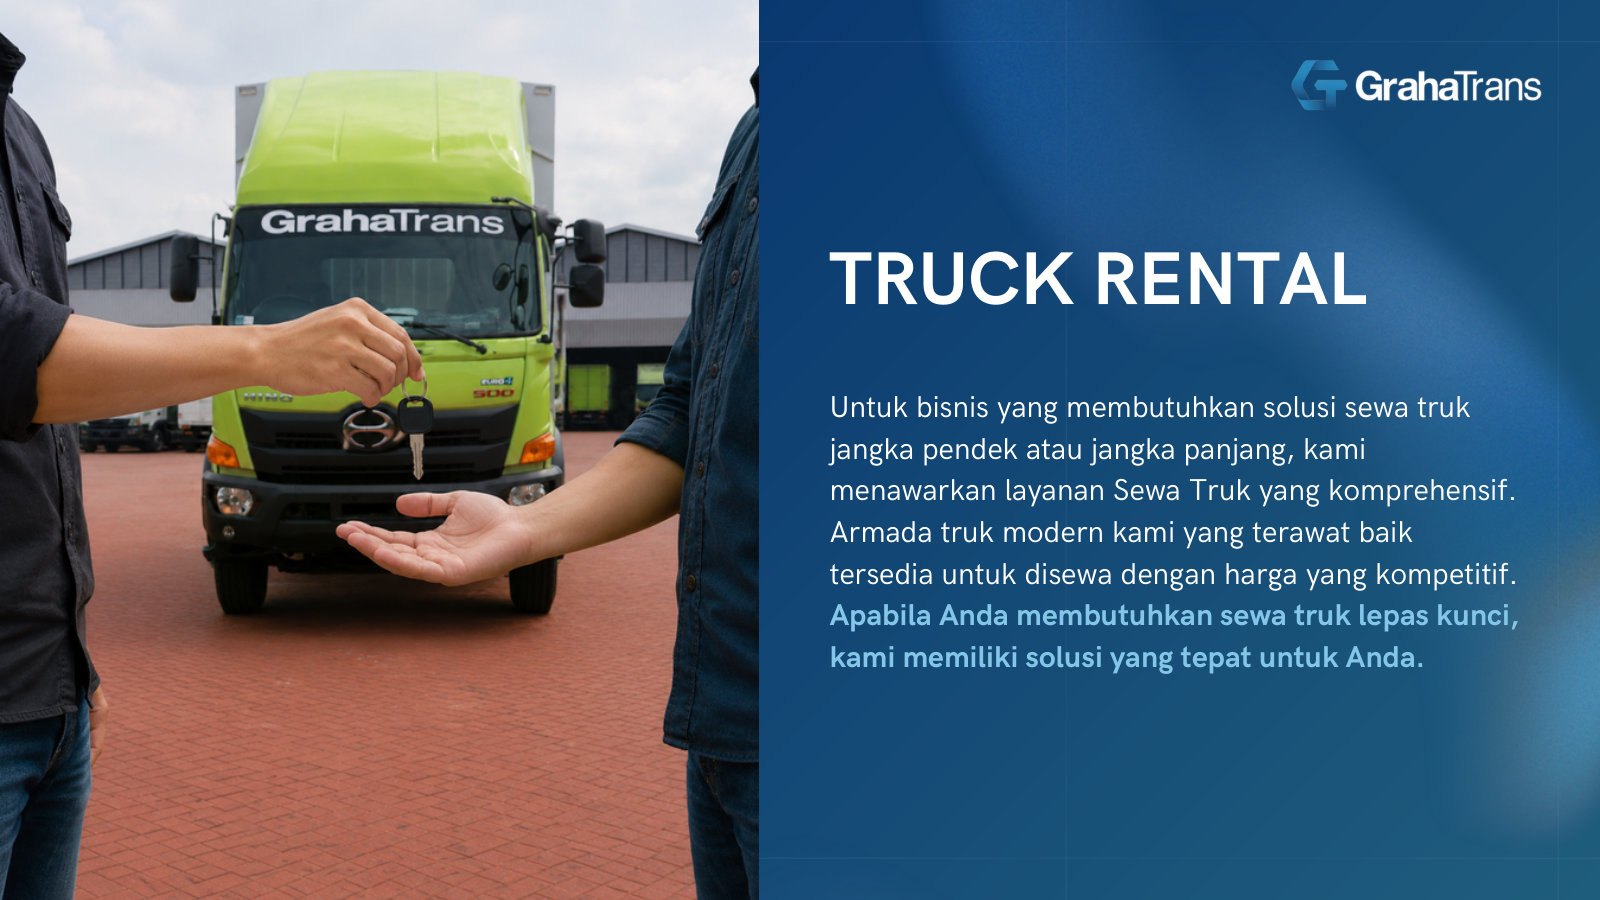
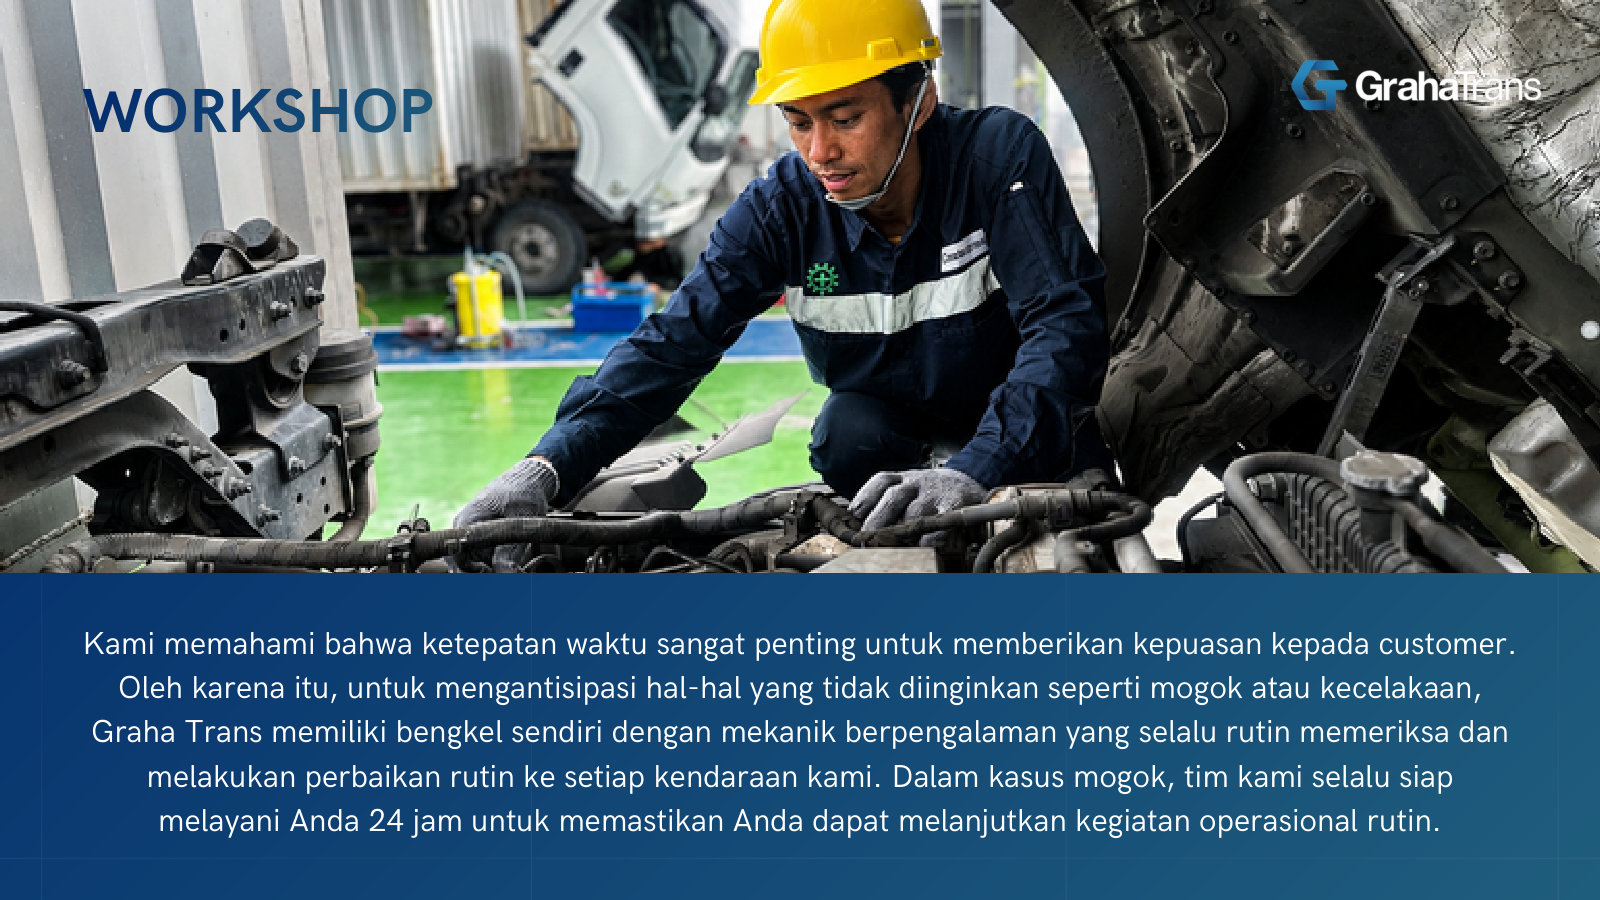
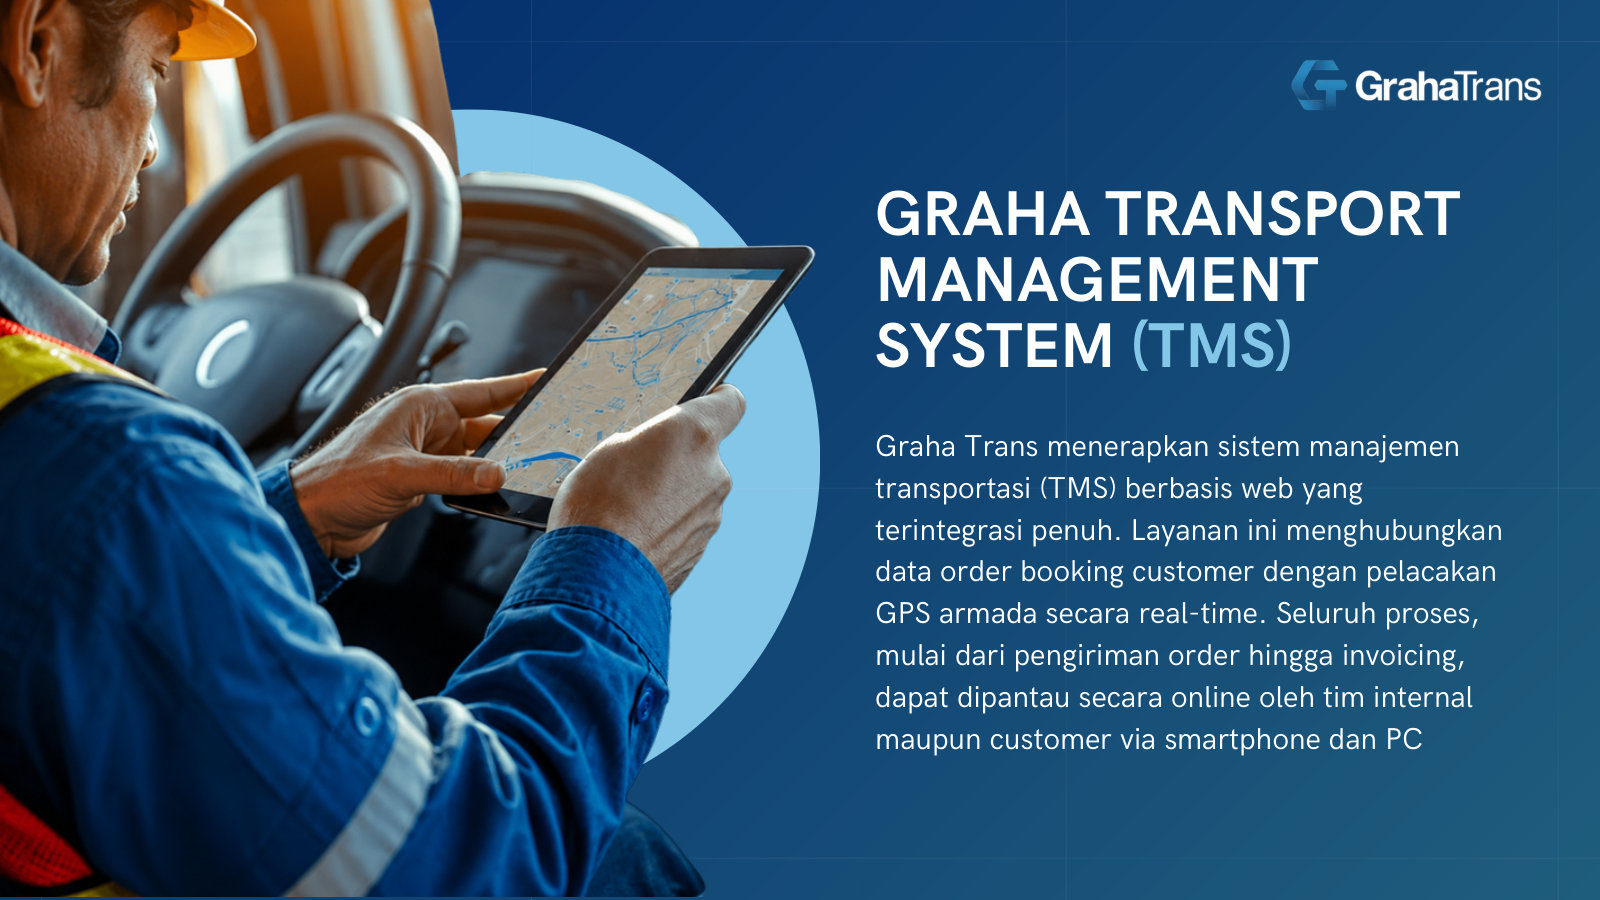
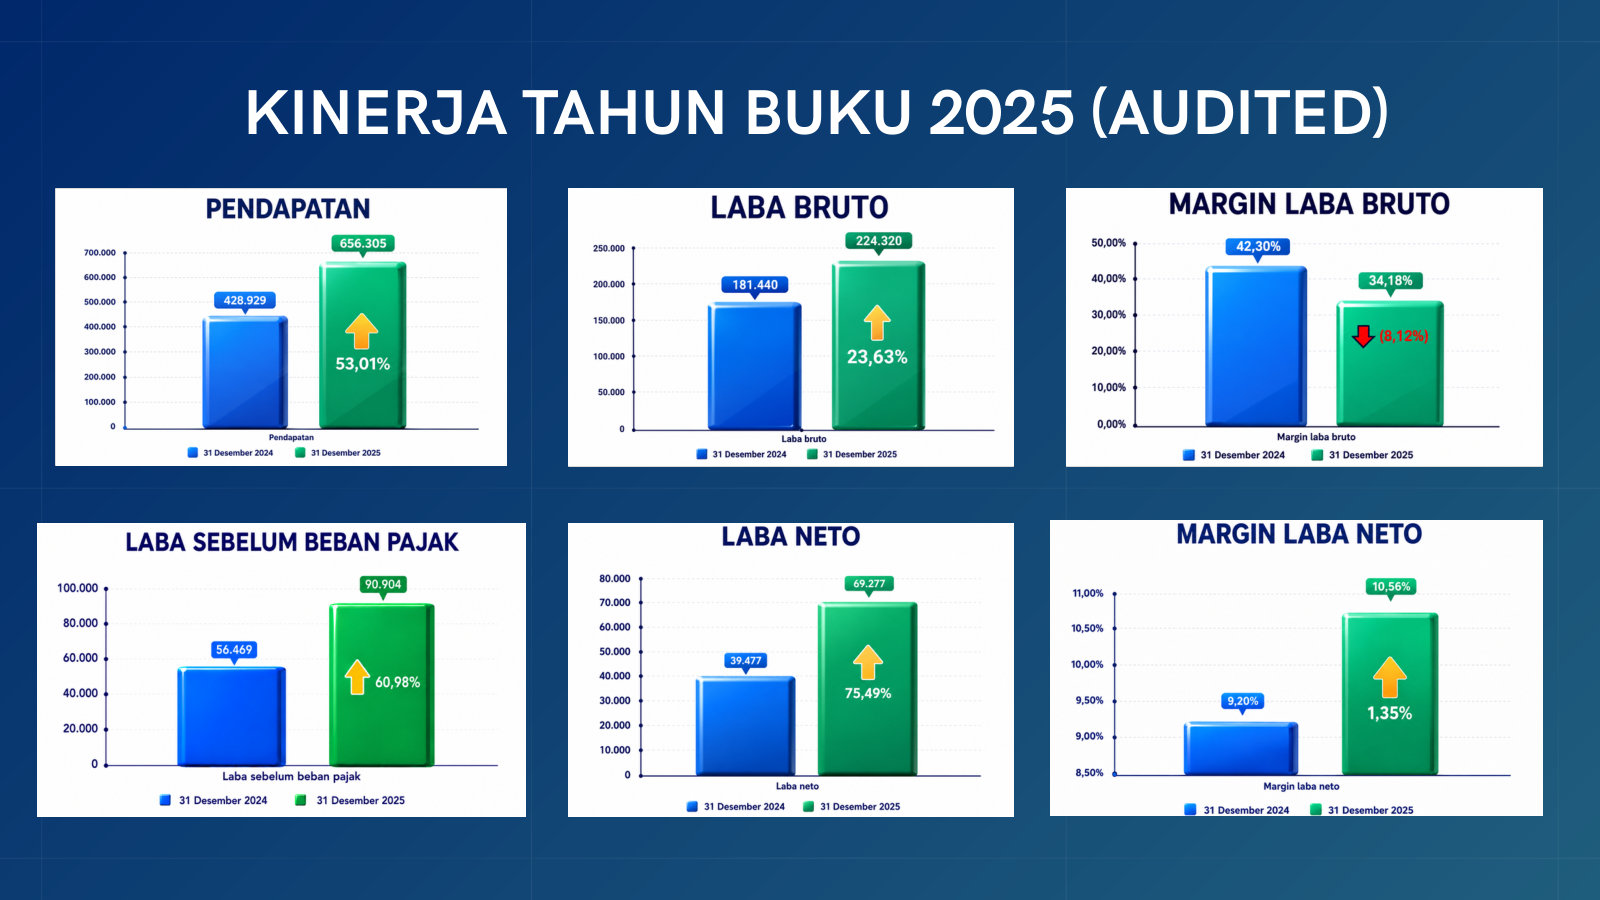
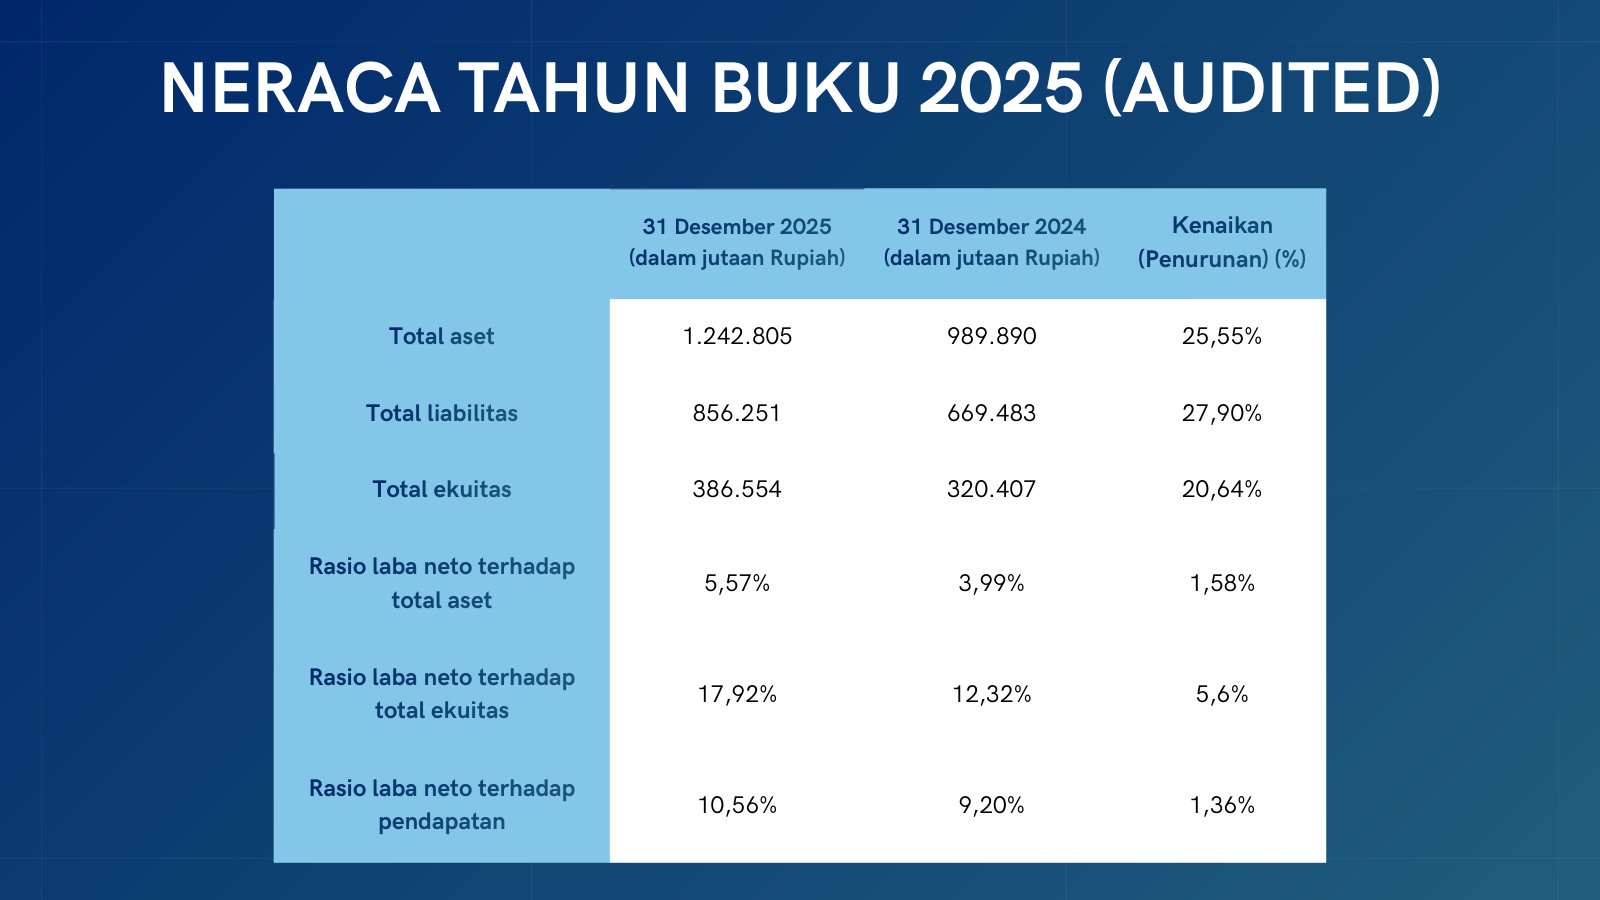
PT Grahaprima Suksesmandiri Tbk's management explains the business in its own materials. The slides below do the most of that work, pulled from the documents preserved in Sources. Each source link opens the complete presentation at that slide in a new tab.
Public Expose 2026 — 2026
The newest public expose — management's fullest current self-portrait: history, services, the TMS platform, latest results and 2026 plans. · Open the full document →
Annual Public Expose 2024 (Paparan Publik Tahunan) — 2024
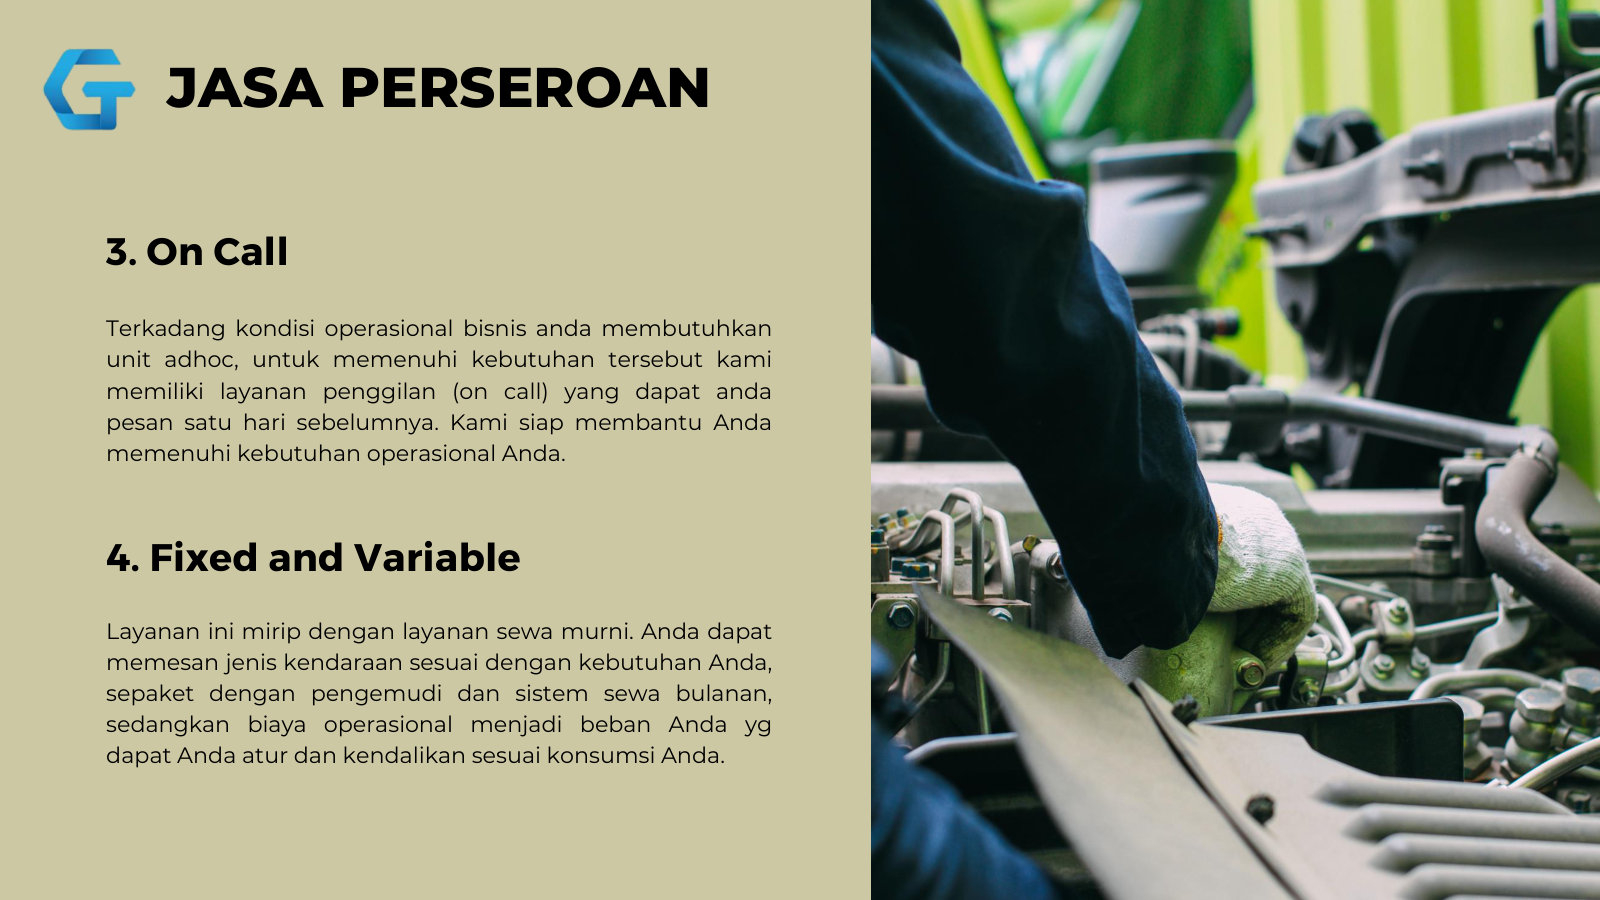
The 2024 annual expose - the fullest account of the business model, with the four service types and full board that newer decks dropped. · Open the full document →
Public Expose 2024 (IPO year) — 2024
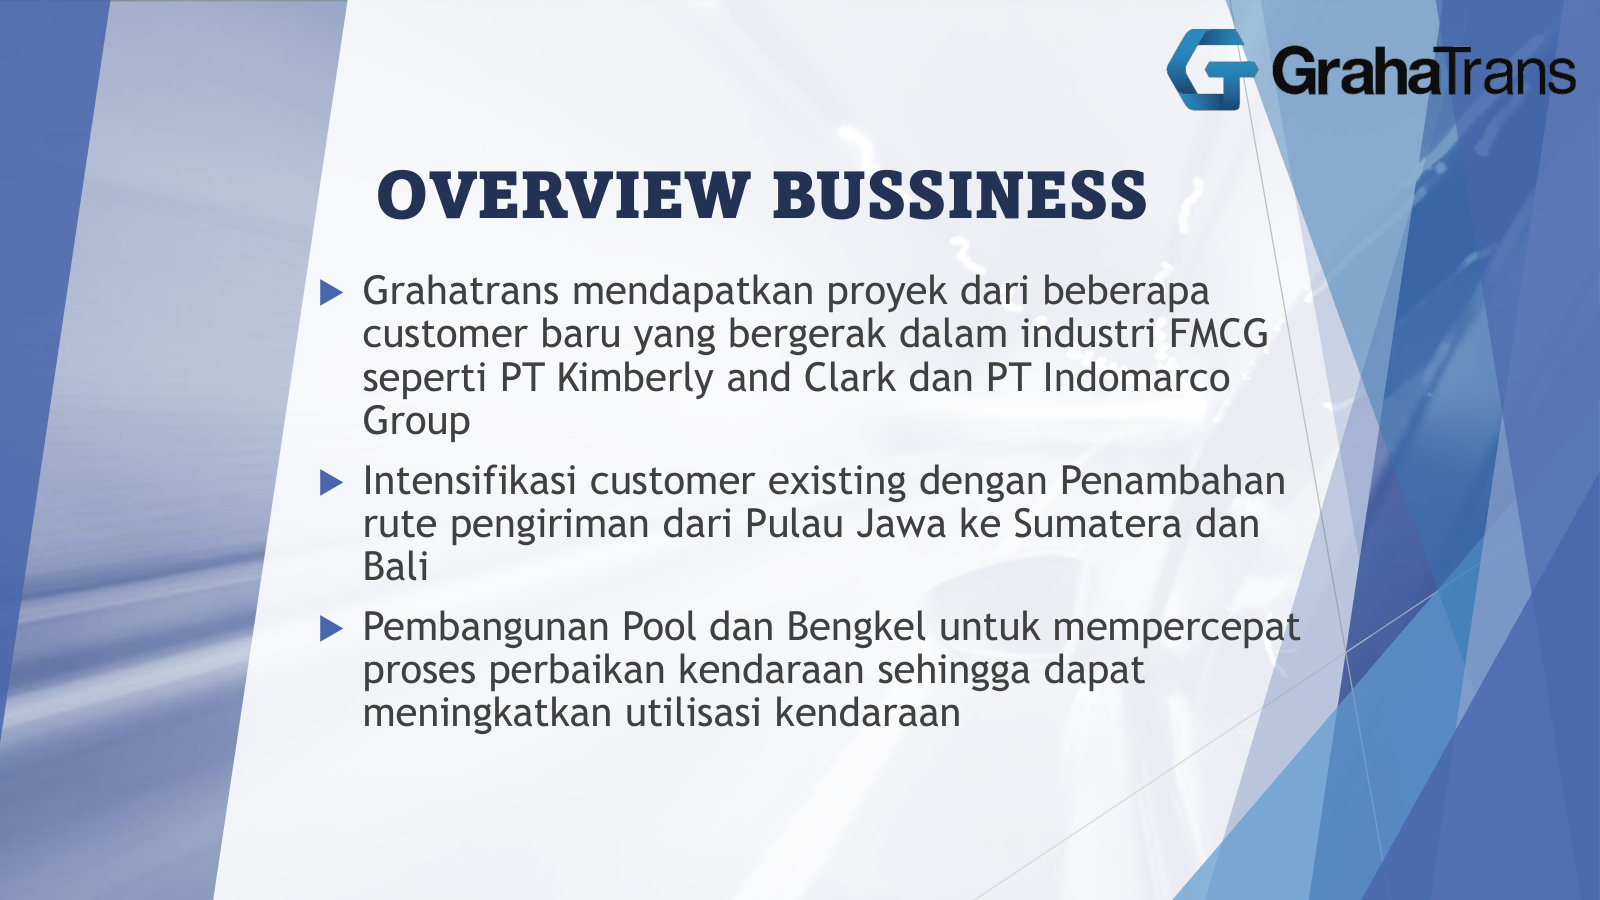
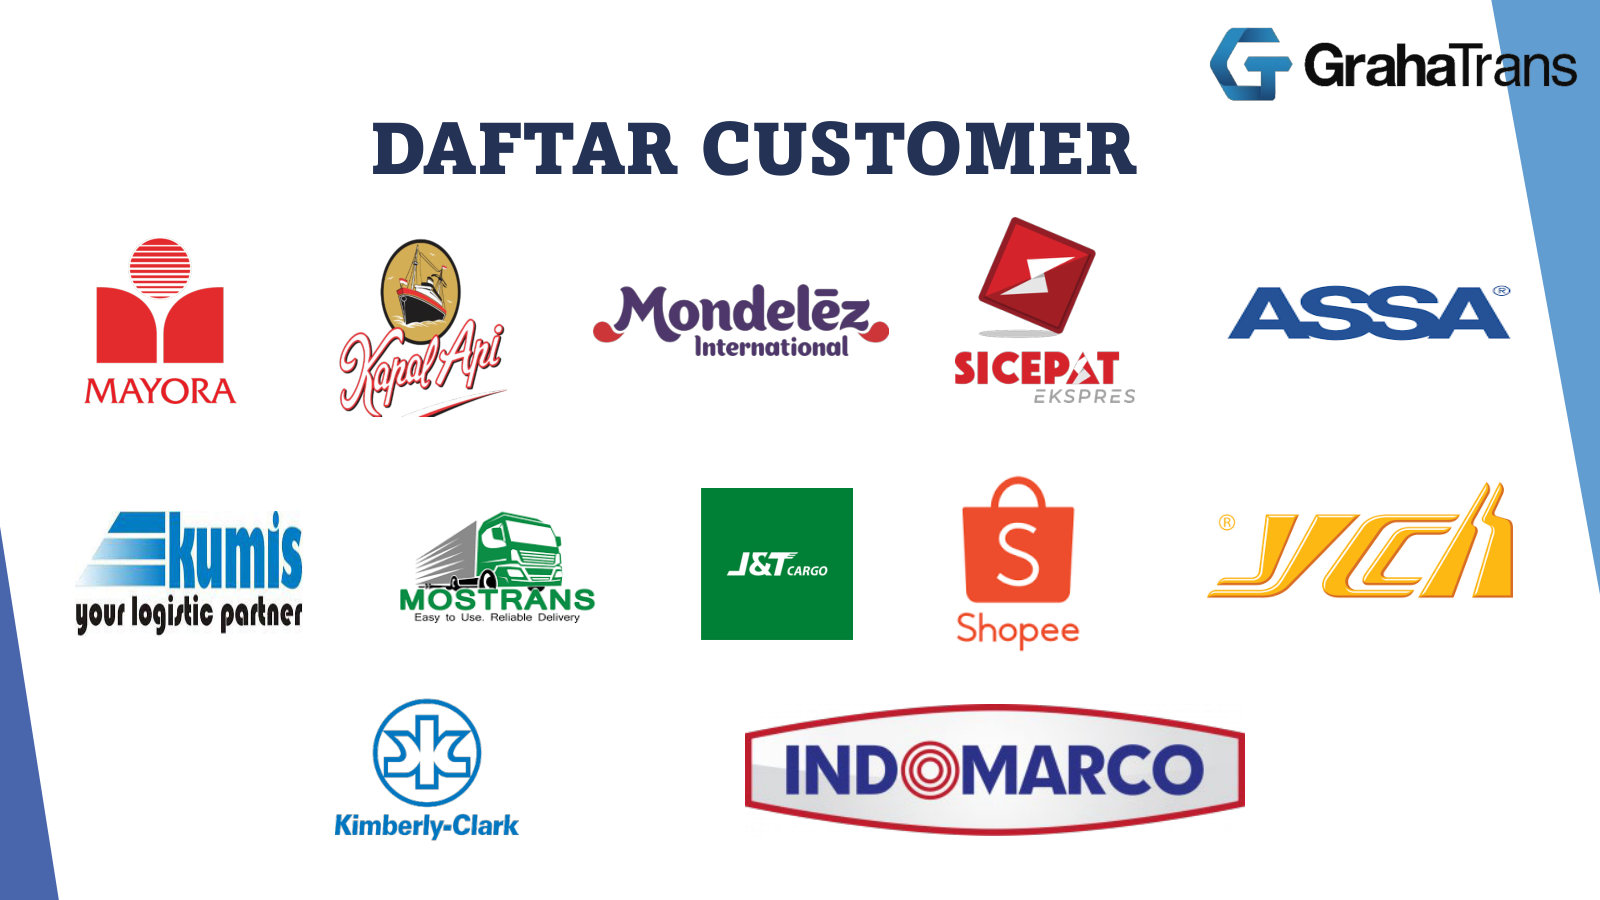
The IPO-year expose, featured for what other decks lack - a named roster of the blue-chip customers behind the revenue. · Open the full document →
More from management
Public Expose 2025 — 2025 · 23 pages · The 2025 edition - FY2024 audited and Q1-2025 results, plus a coverage map with each pool's address, before the 2026 refresh. · Open →
PT Grahaprima Suksesmandiri Tbk's annual reports contain management's most considered account of the business. These are the sections, passages and visual pages worth opening in the originals preserved in Sources.
PT Grahaprima Suksesmandiri Tbk (Graha Trans) — 2025 Annual Report — FY2025
The latest report: revenue up 53% on a flat fleet, a related-party sourcing surge, and auditor-flagged capital intensity — the whole GTRA story in one book. · Open the full document →
Kegiatan dan Bidang Usaha / Business Activities and Sectors — p. 37 · Read the full section →
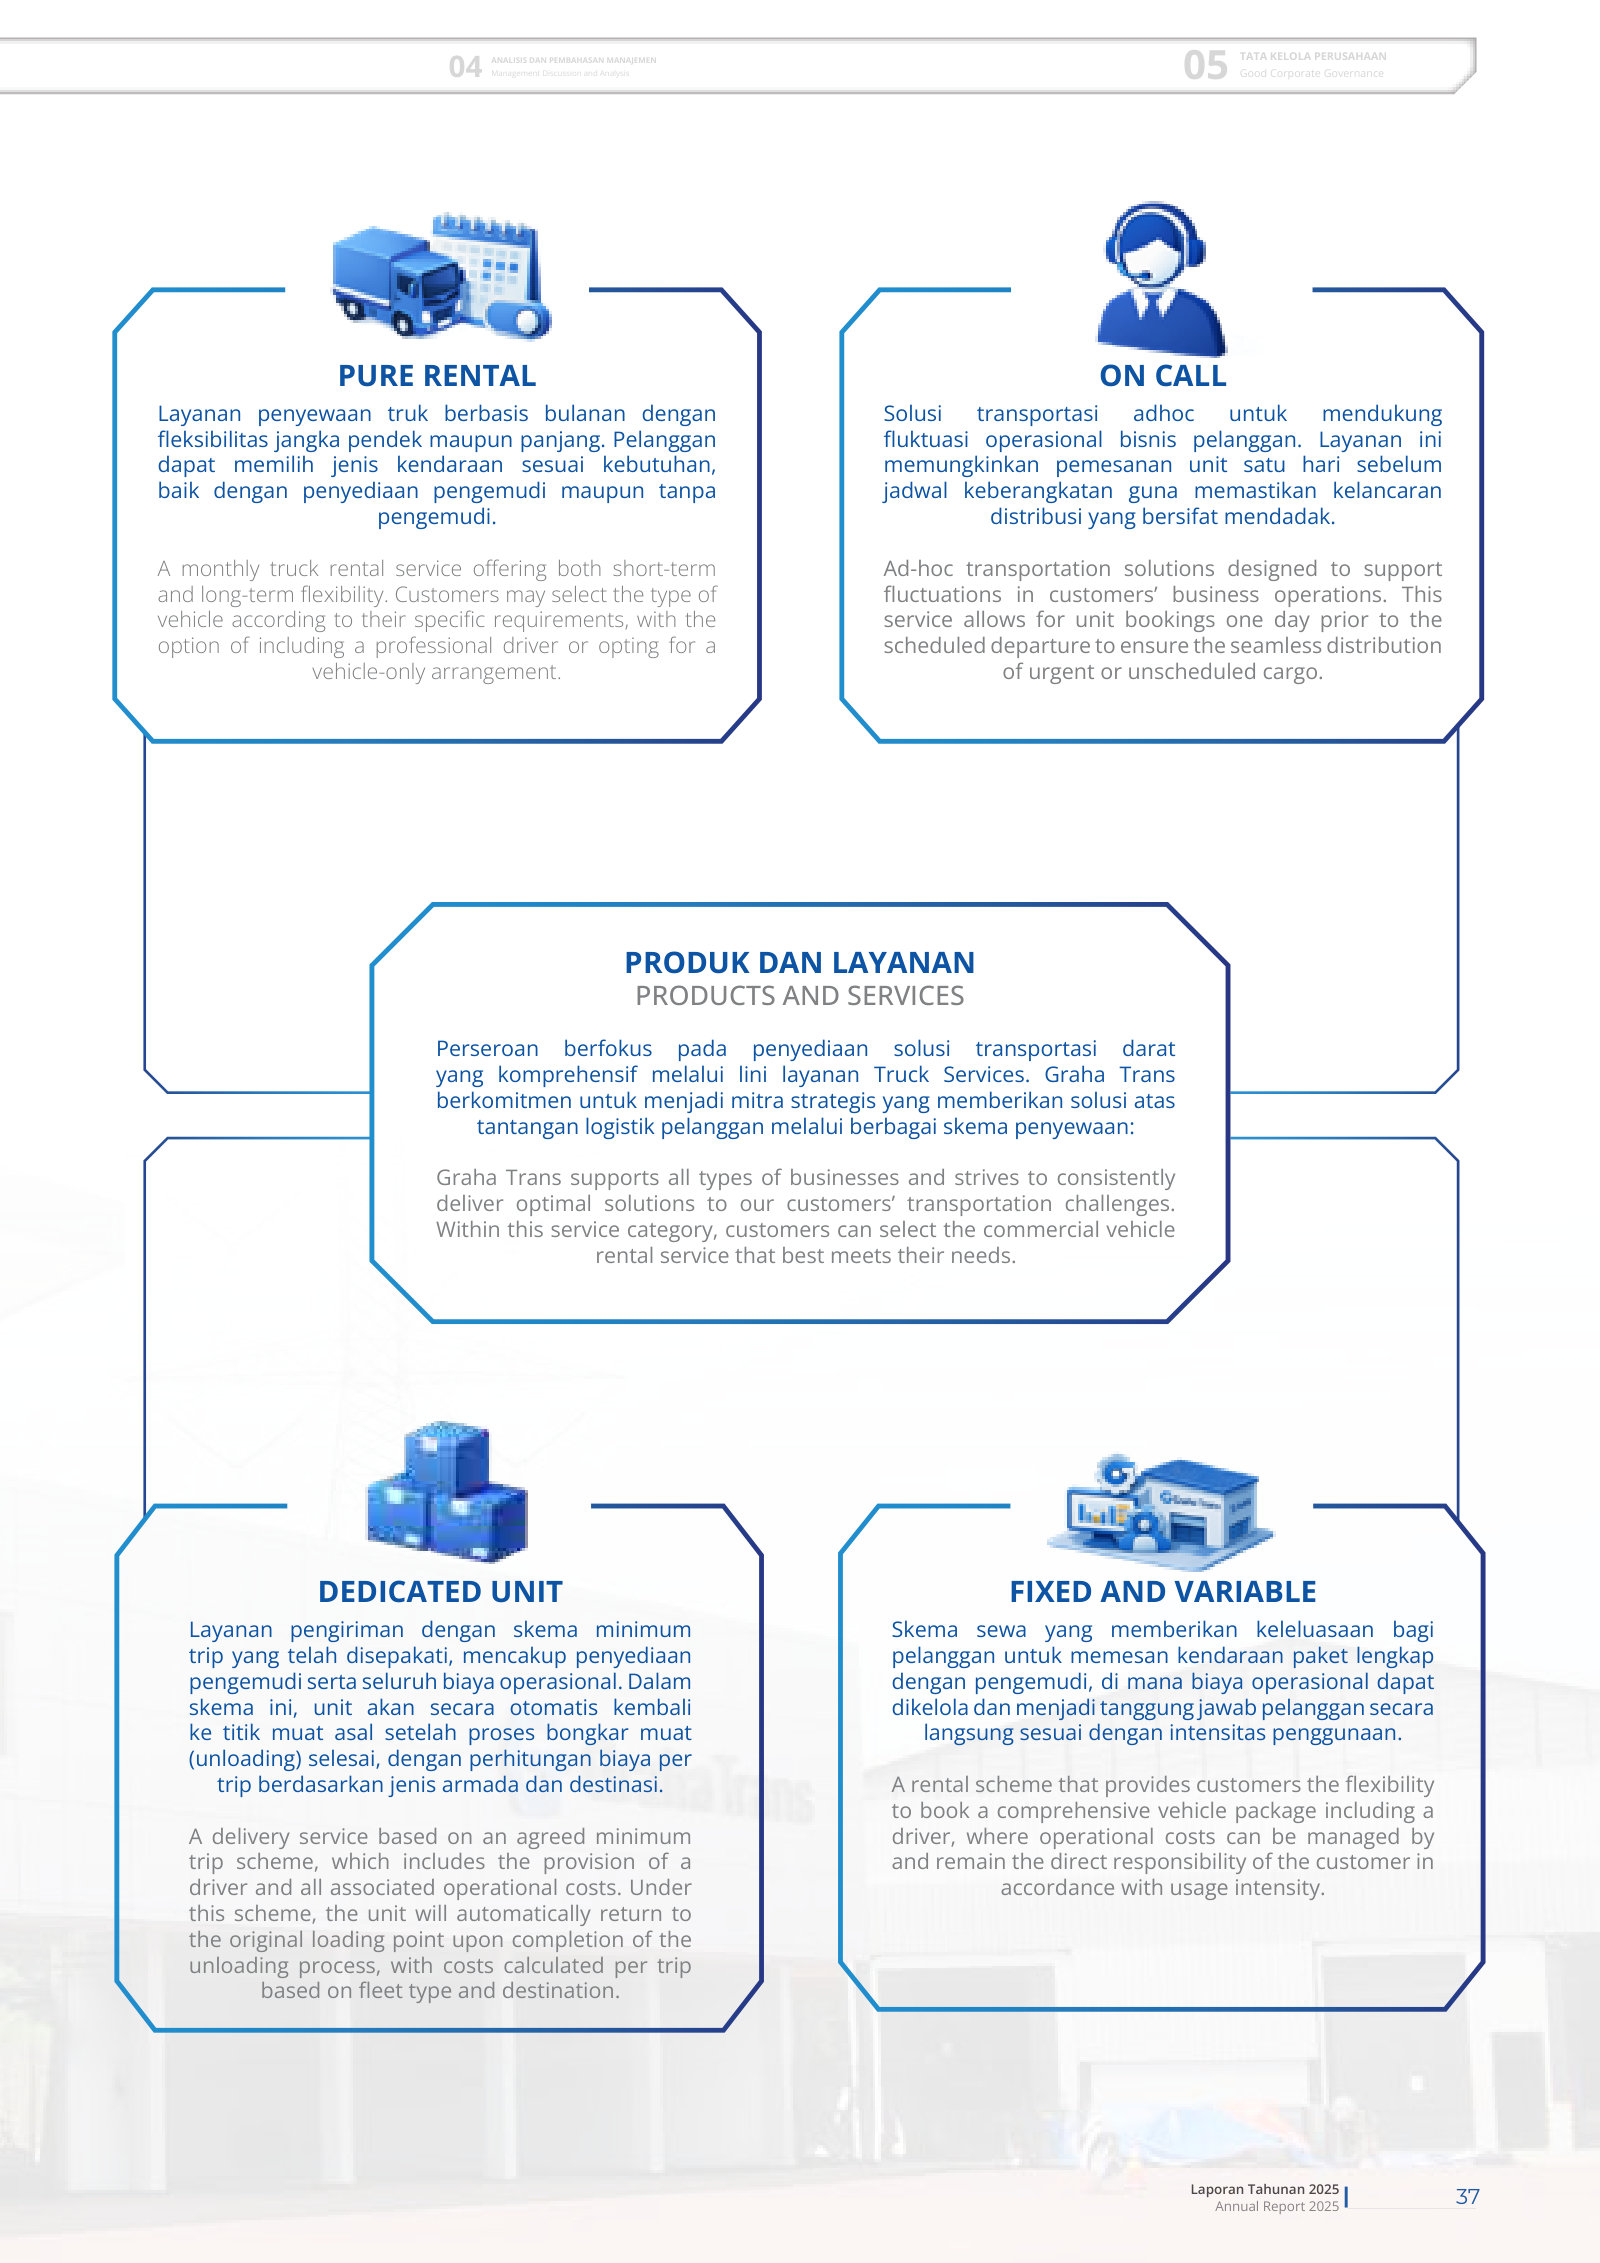
Defines what GTRA actually does — motorized transport of general cargo — and the rental service models it sells it through.
The chartered business purpose: land transport of general cargo through specialized service categories.
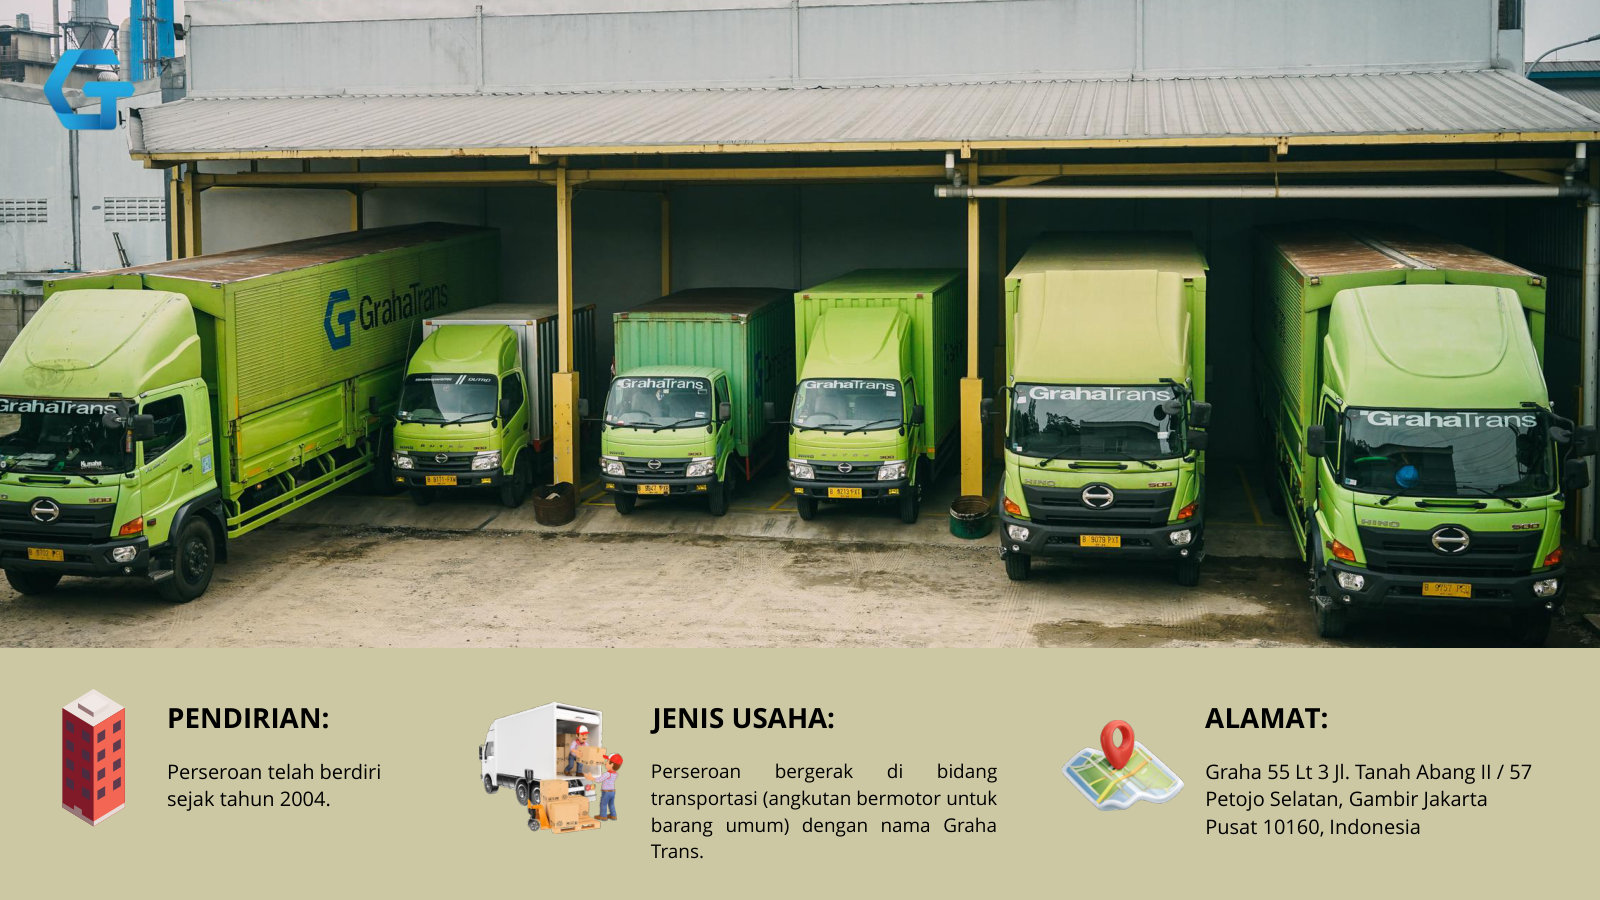
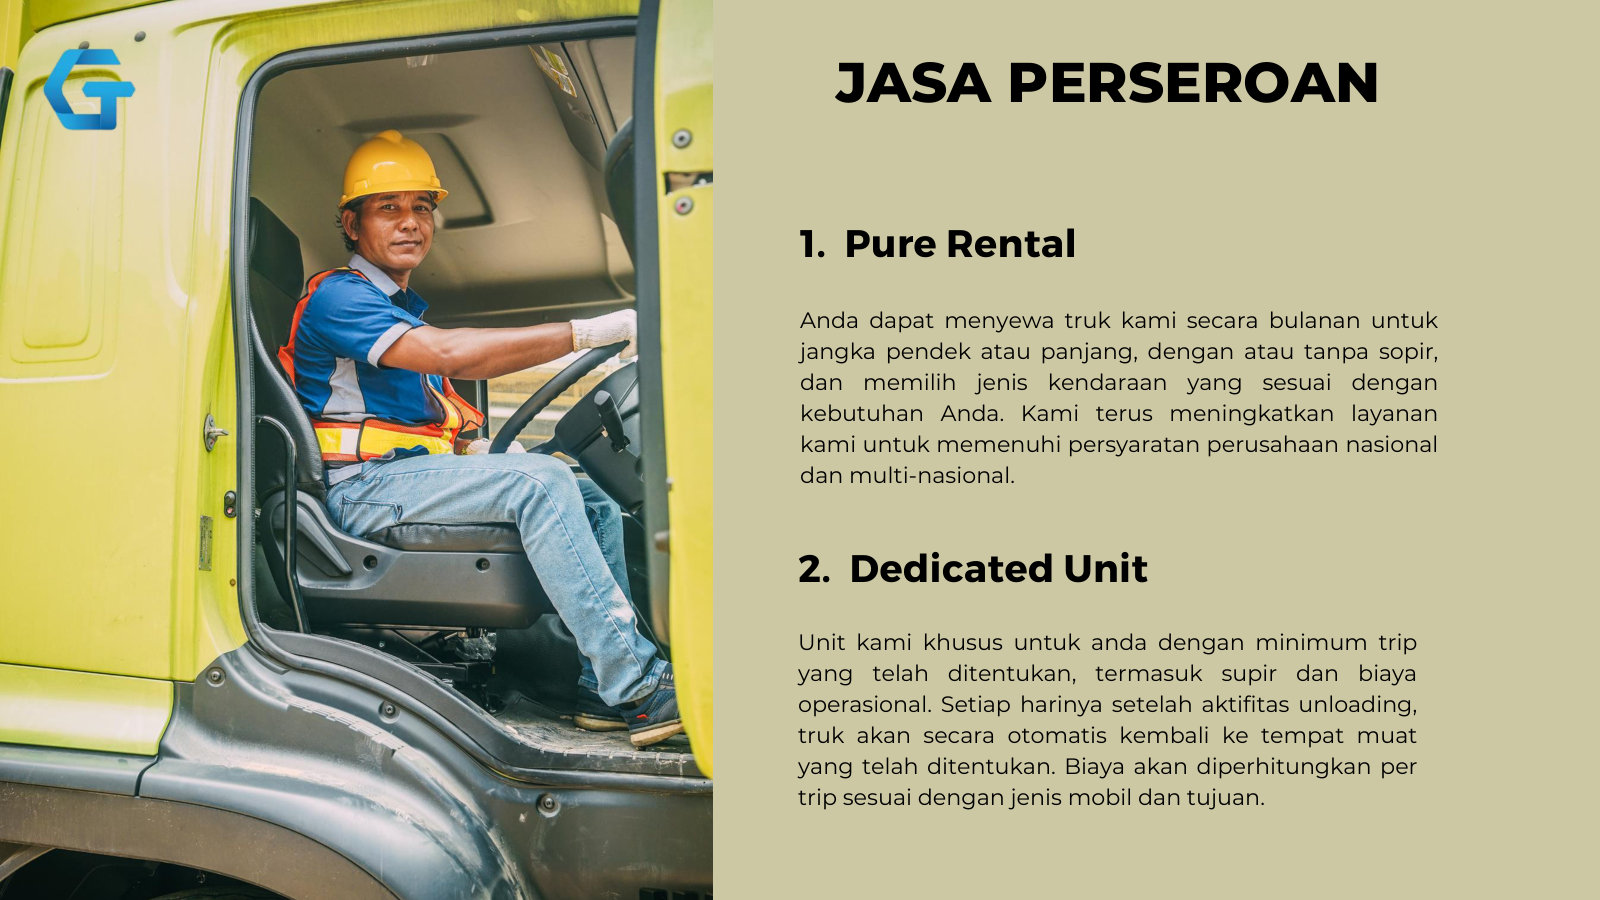
Pursuant to Article 3 of the Company’s Articles of Association, Graha Trans conducts its primary business activities in the field of motorized transportation for general cargo. The Company’s objective and purpose are to provide reliable land transportation services through the following specialized service categories:
p. 37 · Read in context →
Analisis & Pembahasan Manajemen / Management Discussion and Analysis — p. 66 · Read the full section →
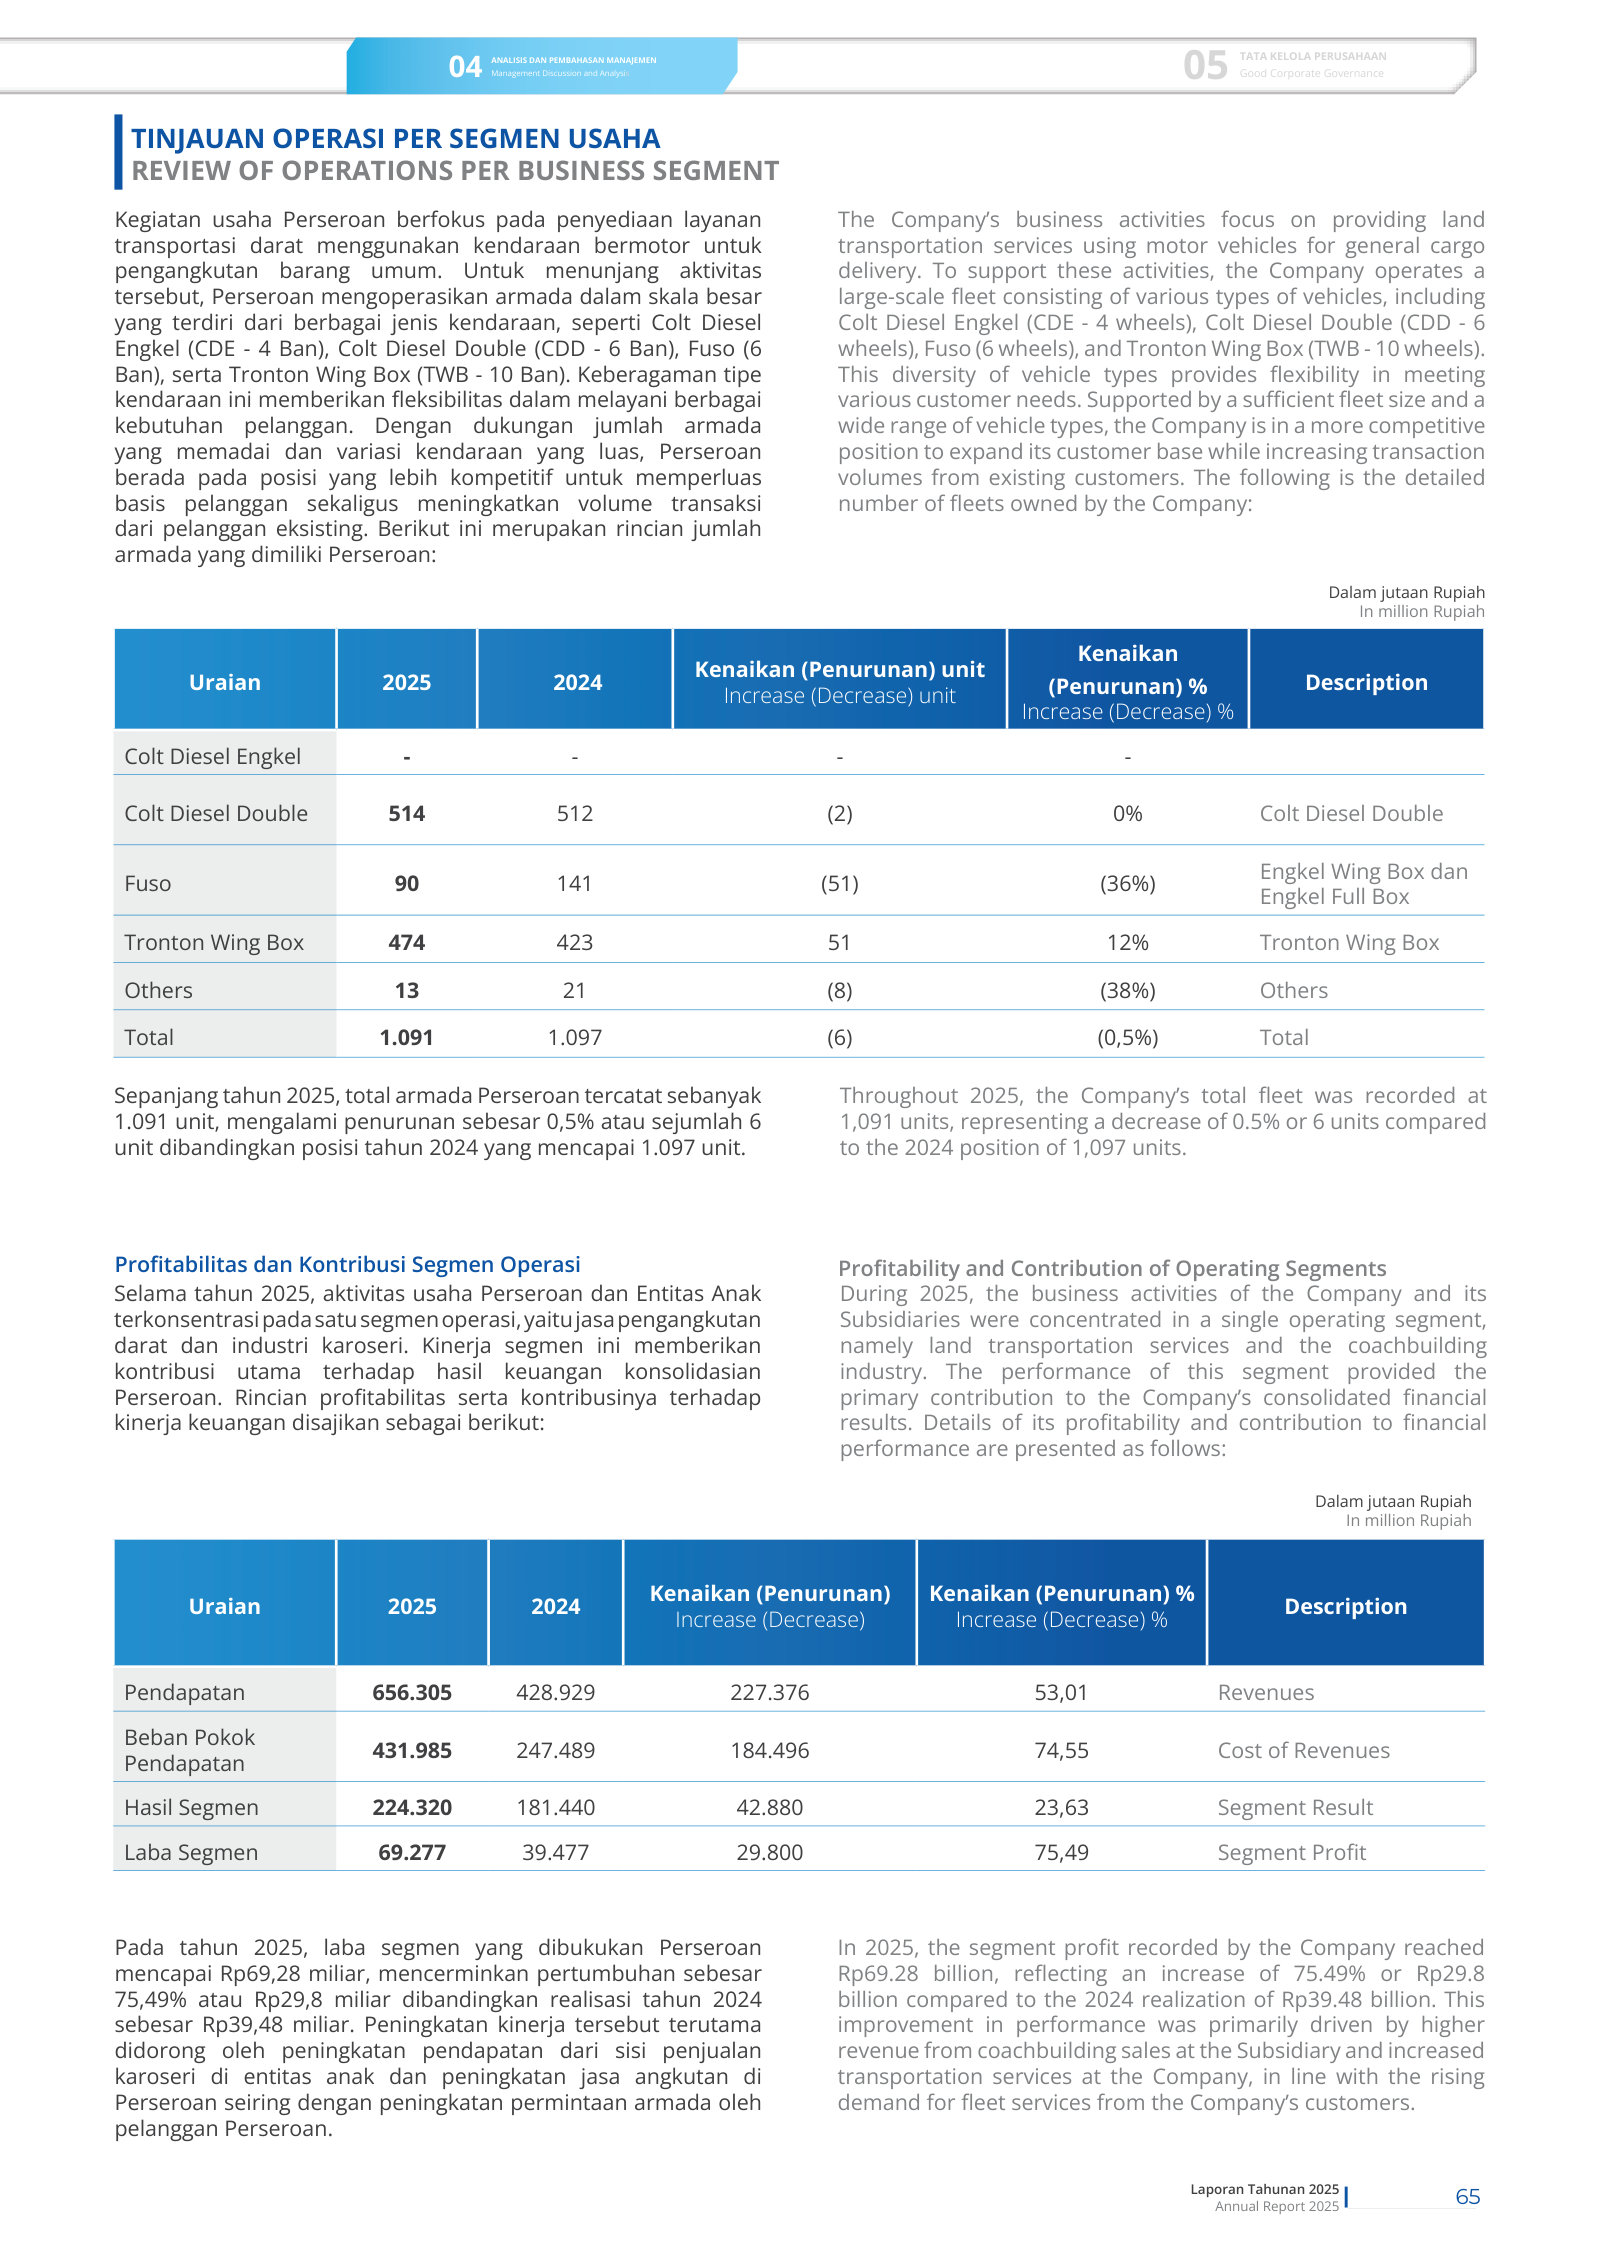
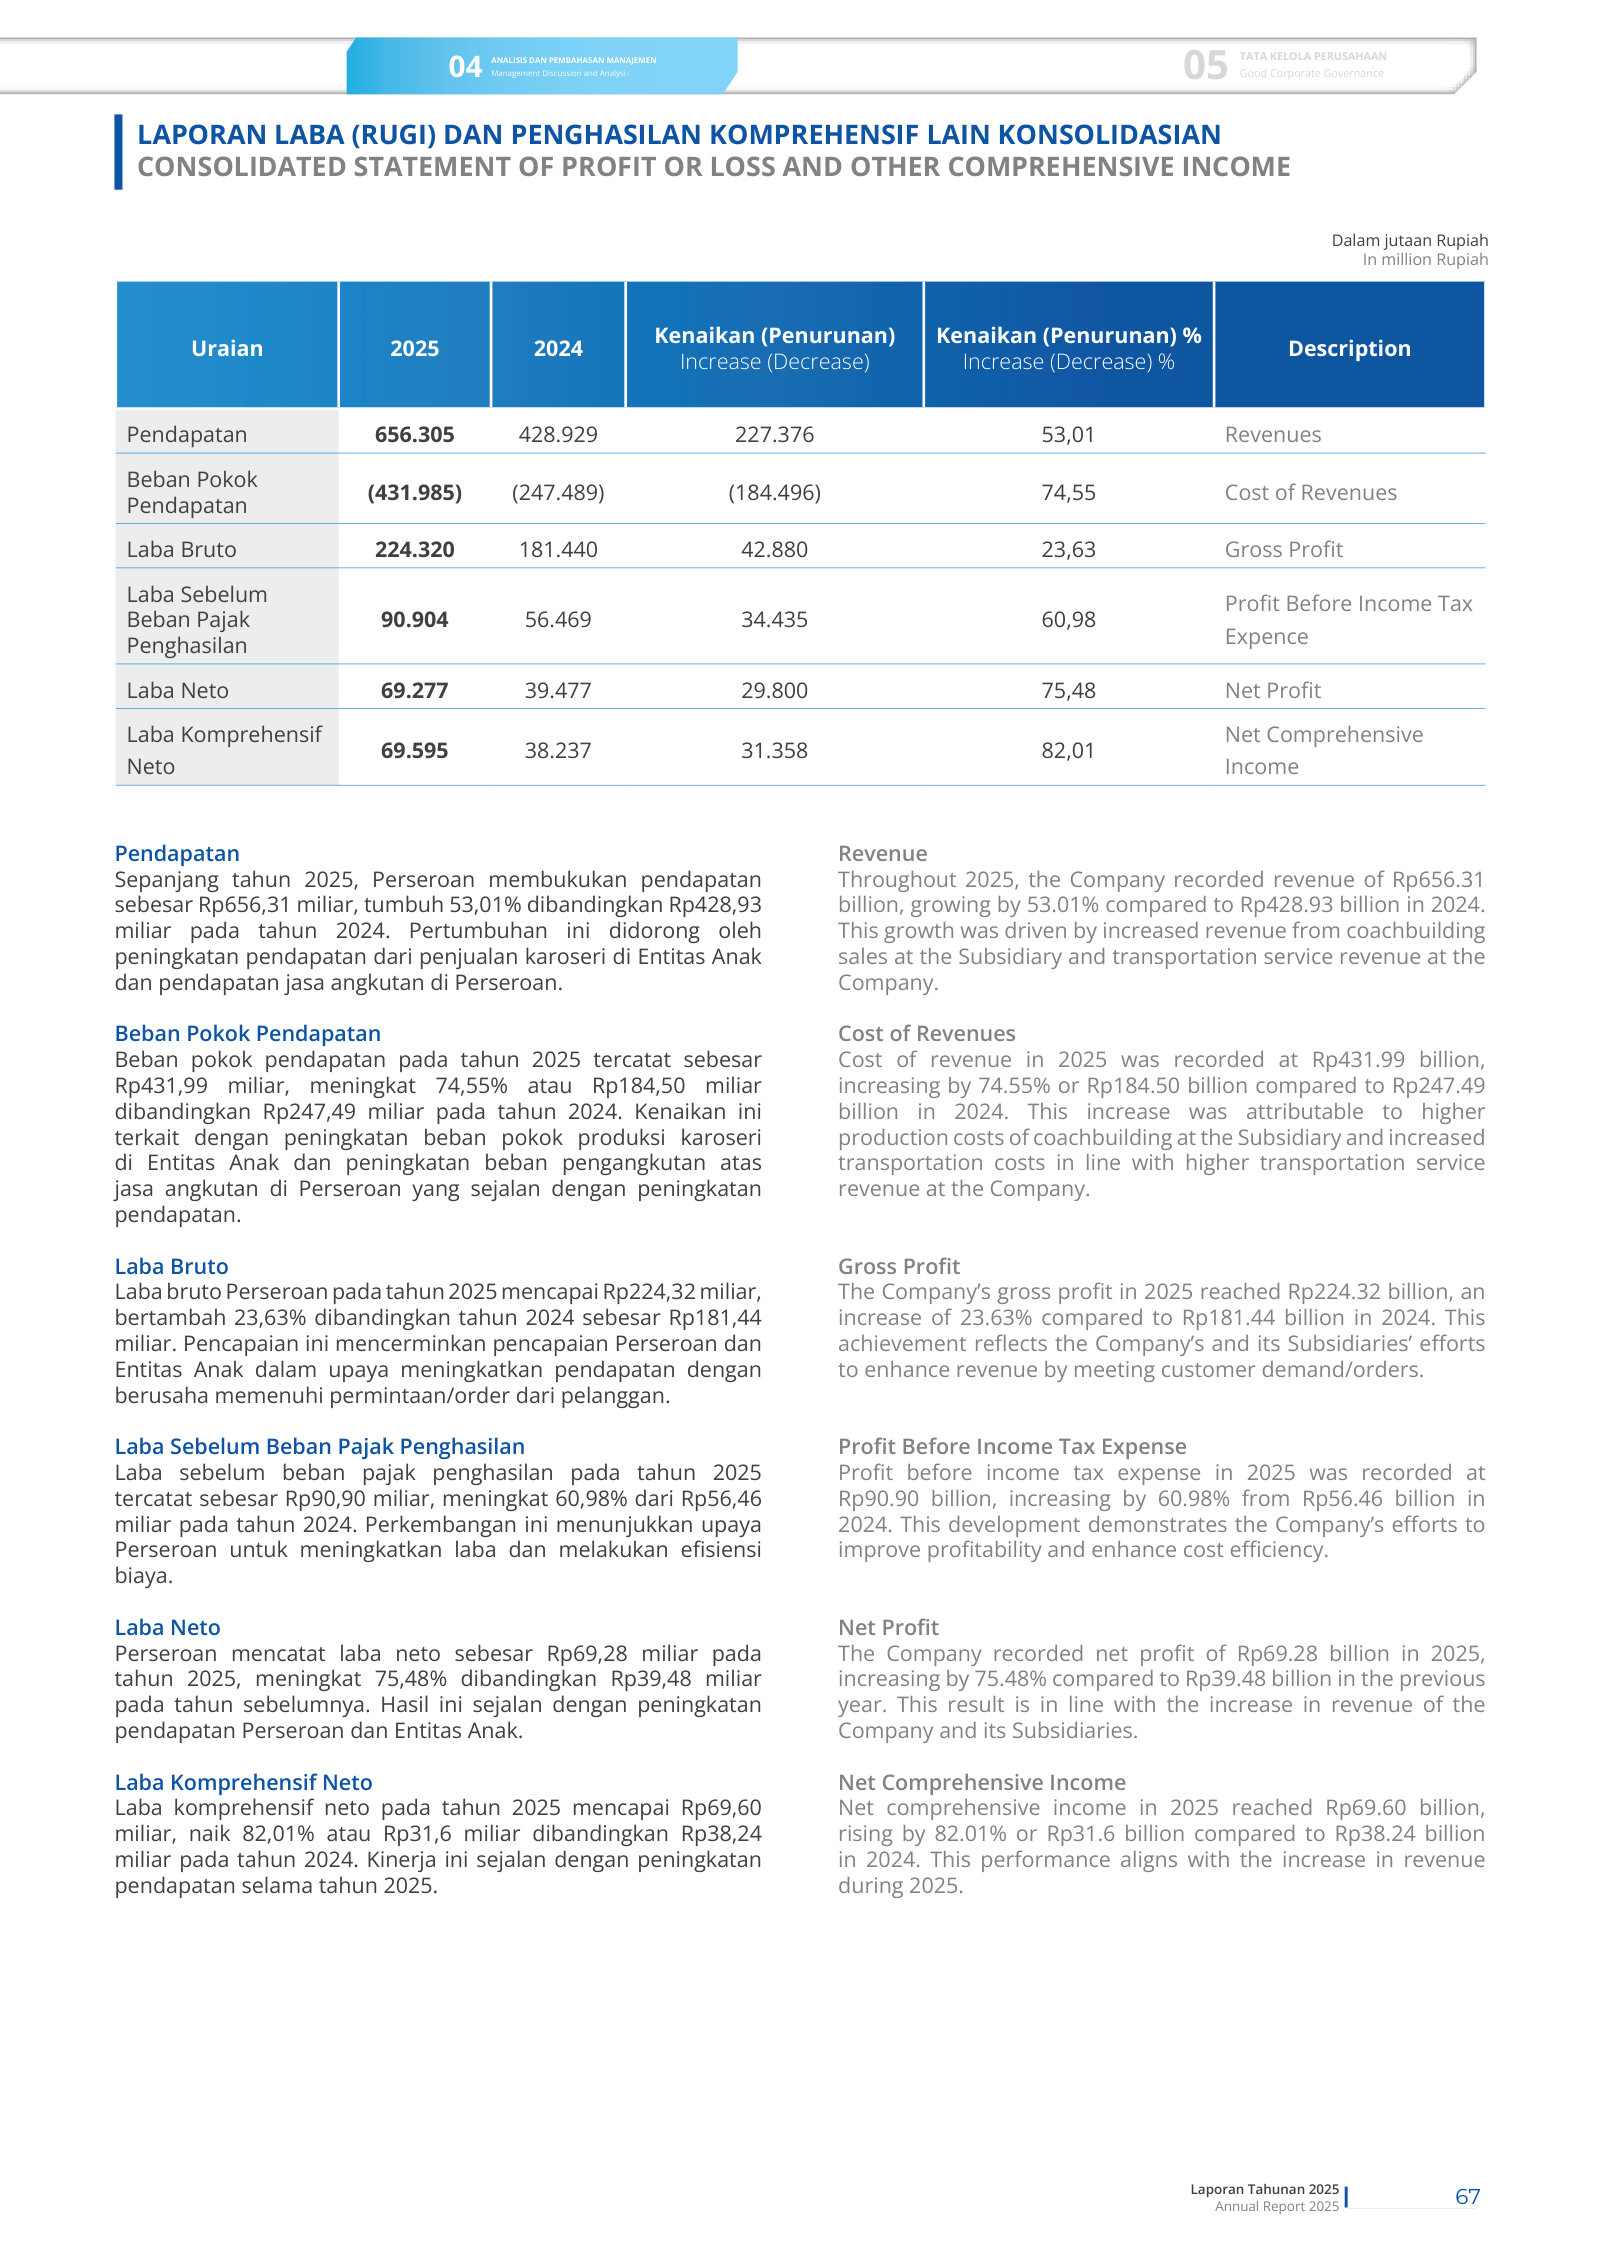
The crux: the owned fleet was essentially flat (1,091 units) yet consolidated revenue jumped 53% — showing the growth came from coachbuilding, not more trucking.
Prospek Usaha / Business Outlook — p. 72 · Read the full section →
Management's stated 2026 plan centers on the Deltamas Pool — its bet on in-house coachbuilding, retreading and maintenance to cut costs.
The Deltamas Pool: a ~30,000 sqm integrated hub with a bodywork plant and retreading plant.
Optimism toward 2026 is also supported by various strategic initiatives that have been prepared and implemented throughout 2025, particularly in improving vehicle utilization and strengthening operational capabilities. One of the key initiatives is the development of the Deltamas Pool, which is targeted to commence operations as an integrated operational center on nearly 30,000 square meters of land. This facility will be equipped with an internal workshop, training center, bodywork manufacturing and repair plant, as well as a retreading plant.
p. 72 · Read in context →
Pangsa Pasar / Market Share — p. 75 · Read the full section →
Names the demand base — large FMCG distributors plus e-commerce, all domestic — the concentration that both drives and constrains the book.
Customer base dominated by large-scale FMCG producers needing high-volume distribution.
As of the end of 2025, the Company’s customer composition was dominated by companies operating in the fast-moving consumer goods (FMCG) sector, particularly those with large-scale production and high-volume distribution requirements.
p. 75 · Read in context →
Expansion into e-commerce partnerships; the entire base is Indonesia-domestic.
In line with the development of its business model, the Company has also expanded its market penetration by establishing partnerships with e-commerce players. All of these customers operate within Indonesia, therefore the Company’s market focus remains centered on domestic logistics needs.
p. 75 · Read in context →
Transaksi dengan Pihak Berelasi / Transactions with Related Parties — p. 77 · Read the full section →
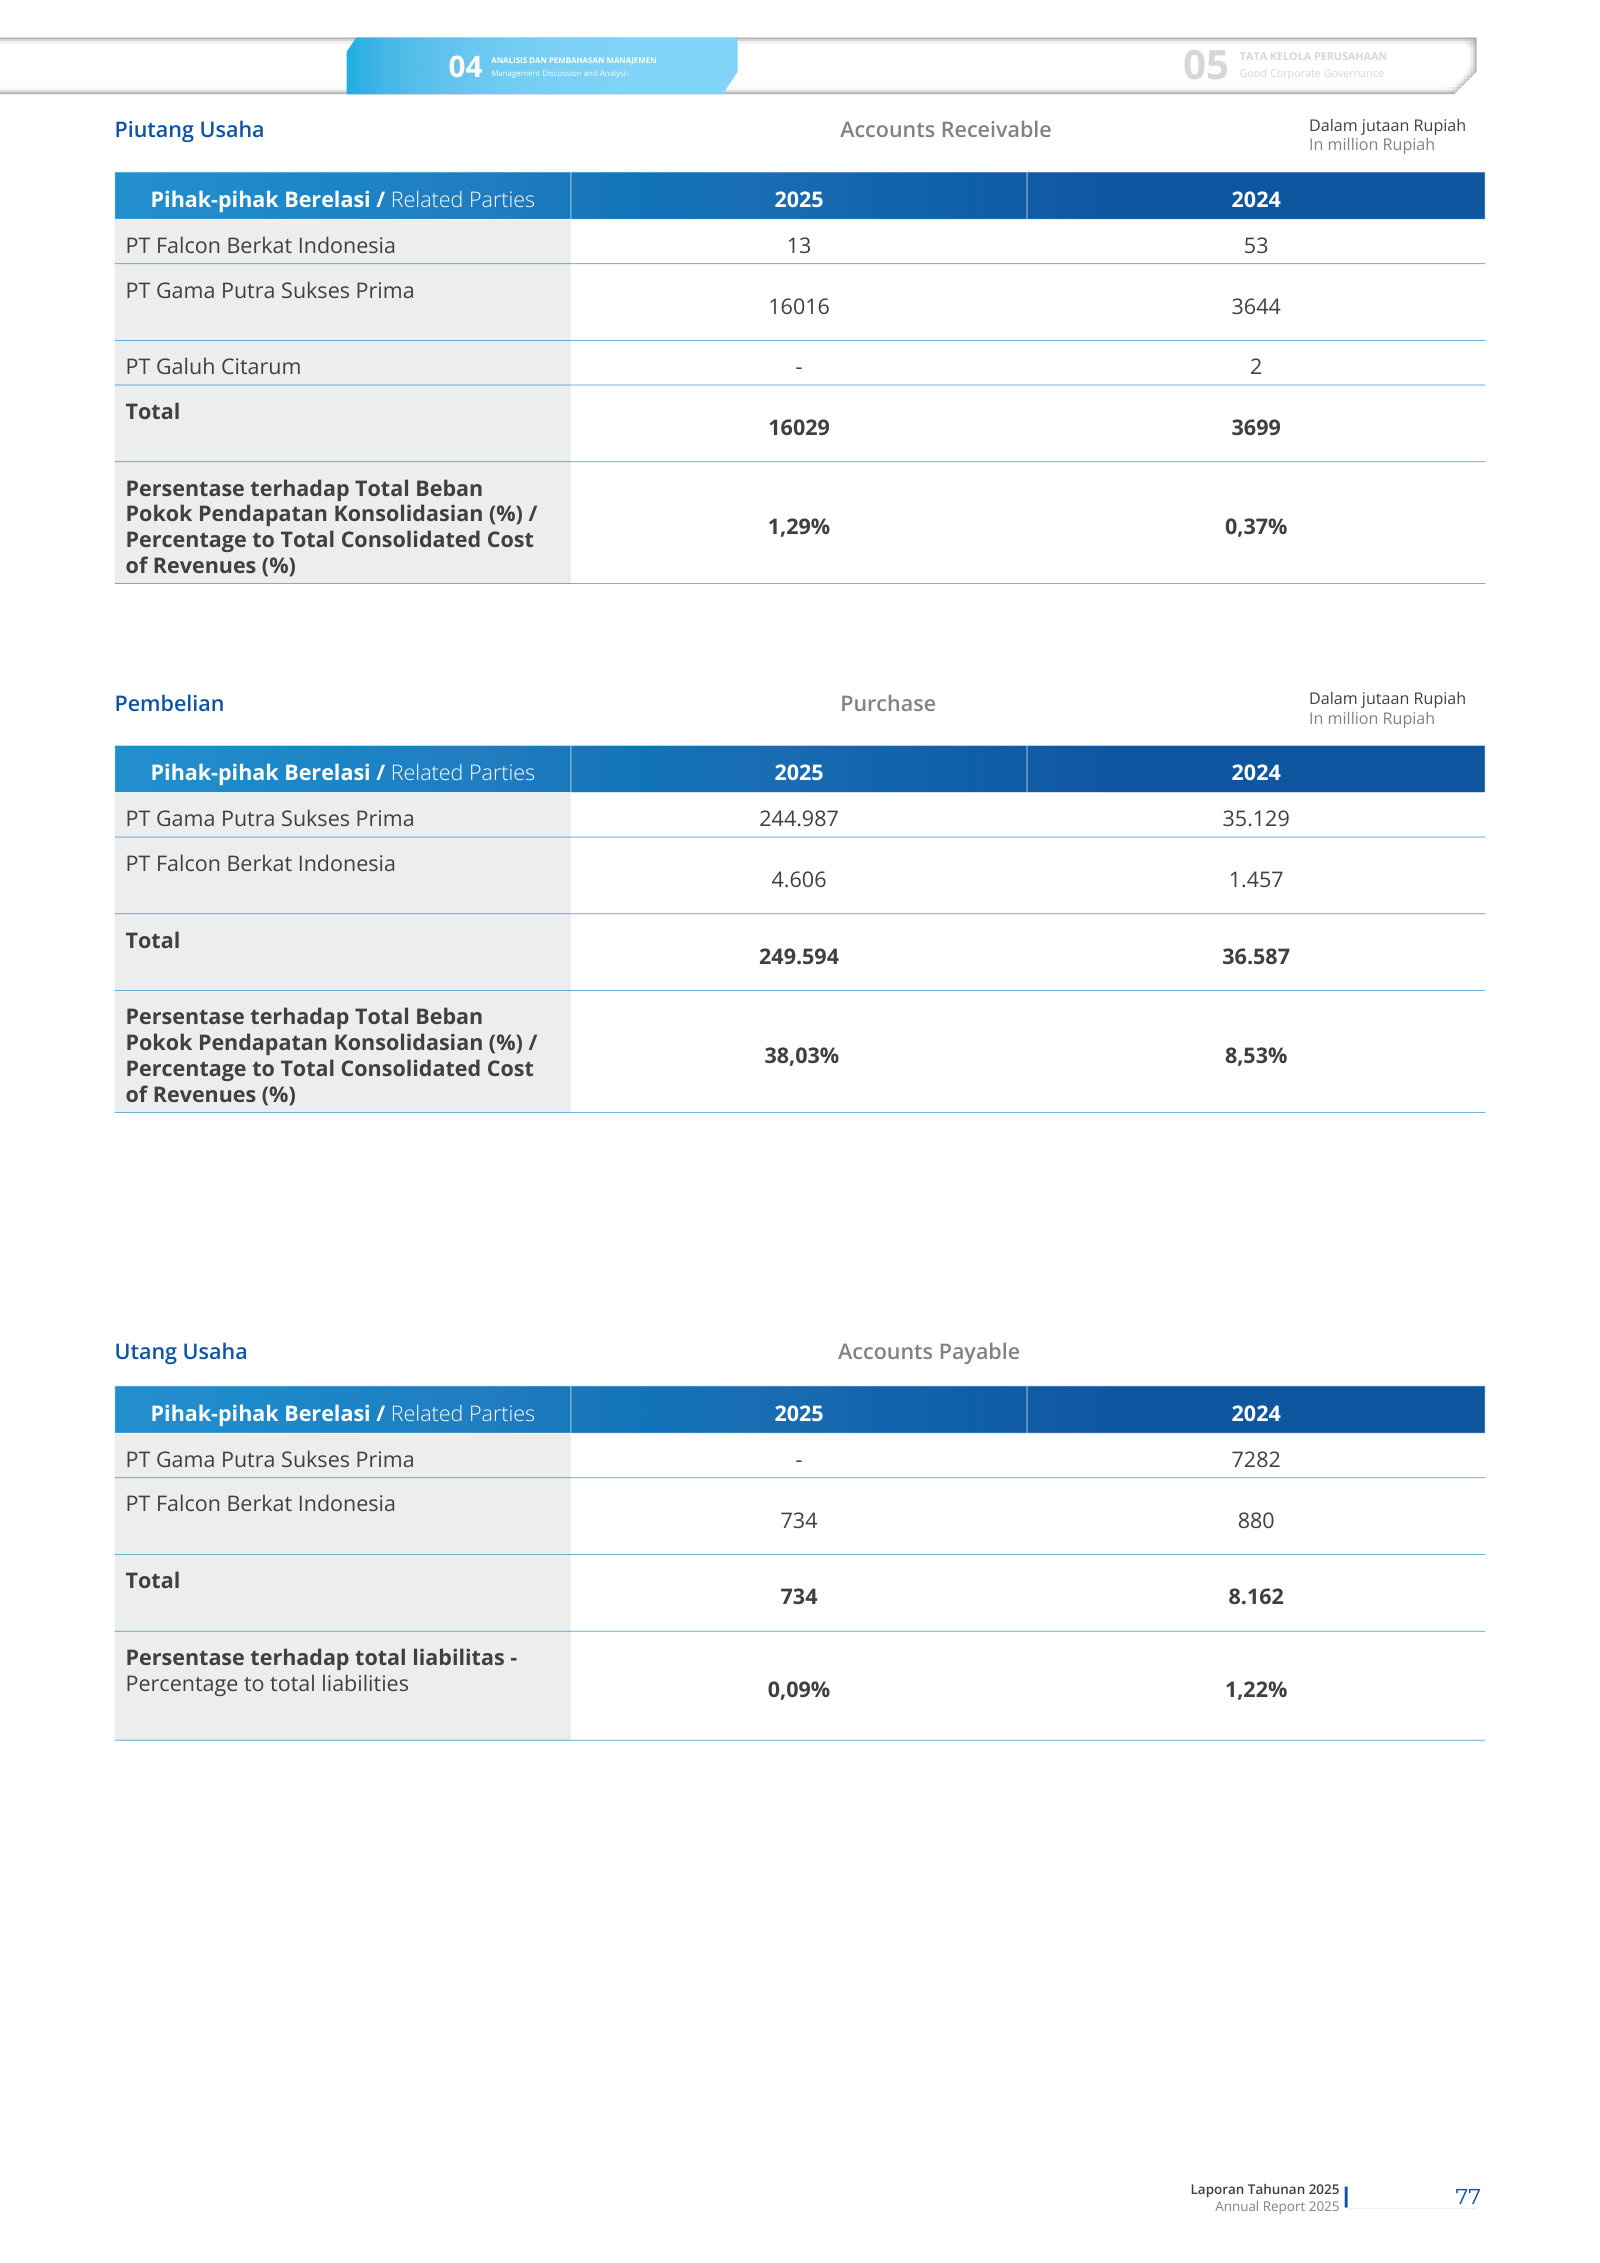
The single most consequential disclosure: related-party purchases from PT Gama Putra Sukses Prima jumped to 38% of consolidated cost of revenues.
Management frames related-party dealings as support for “operations and business synergies.”
In conducting its business activities during 2025, the Company engaged in transactions with several related parties. These relationships were established to support operations and business synergies.
p. 77 · Read in context →
Manajemen Risiko / Risk Management — p. 111 · Read the full section →
The two risks that most fit a debt-funded fleet operator with related-party customers: trade-receivable credit risk and liquidity from heavy capex.
Credit risk centers on trade receivables from operating activities (original Indonesian text).
Risiko kredit yang dihadapi Perseroan berasal dari kegiatan operasi (terutama dari piutang usaha kepada pihak ketiga) dan dari kegiatan pendanaan, termasuk rekening bank.
p. 111 · Read in context →
Liquidity risk: capex and expansion drive a need for substantial working capital (original Indonesian text).
Risiko likuiditas didefinisikan sebagai risiko saat posisi arus kas Perseroan menunjukkan bahwa penerimaan jangka pendek tidak cukup menutupi pengeluaran jangka pendek. Kebutuhan likuiditas Perseroan secara historis timbul dari kebutuhan untuk membiayai investasi dan pengeluaran barang modal terkait dengan program perluasan usaha. Perseroan membutuhkan modal kerja yang substansial untuk menjalankan proyek-proyek baru dan untuk mendanai operasional.
p. 111 · Read in context →
Hal Audit Utama / Key Audit Matters (Independent Auditor's Report) — p. 184 · Read the full section →
The auditor's own list of what most needs judgment — a clean read on the accounting that defines this business model.
Fixed assets are 76.93% of total assets; trucks depreciated on a units-of-production basis.
As at December 31, 2025, the Group recorded net fixed assets of Rp956, 115,578,312, representing 76.93% of the Group's total assets. […] We identified this area as a key audit matter due to the significant management judgment involved in the recognition, measurement, derecognition, and depreciation of fixed assets. This includes, in particular, determining whether certain expenditures meet the criteria for capitalization, assessing when assets are ready for their intended use, accounting for asset disposals, evaluating indicators of impairment, and determining the appropriate depreciation methods and estimates of the asset's useful economic lives, including trucks that are depreciated using the units-ofproduction method.
p. 184 · Read in context →
Revenue and receivable recoverability — flagged partly because of related-party balances.
For the year ended 31 December 2025, the Group recorded revenue of Rp656,304,660,831, which primarily arises from transportation and coachbuilding services. […] We identified this area as a key audit matter due to the significant judgment involved in revenue recognition, particularly in determining the appropriate timing of revenue recognition, the existence of supporting documentation evidencing the delivery of services or goods, and the assessment of the recoverability of trade receivables
p. 185 · Read in context →
PT Grahaprima Suksesmandiri Tbk (Graha Trans) — 2023 Annual Report — FY2023
The IPO-year baseline: coachbuilding was a rounding error and no single supplier reached 10% of purchases — the “before” against which the FY2025 related-party surge stands out. · Open the full document →
Catatan 24 & 32 / Notes 24 (Cost of Revenues) and 32 (Segment Information) — p. 281 · Read the full section →
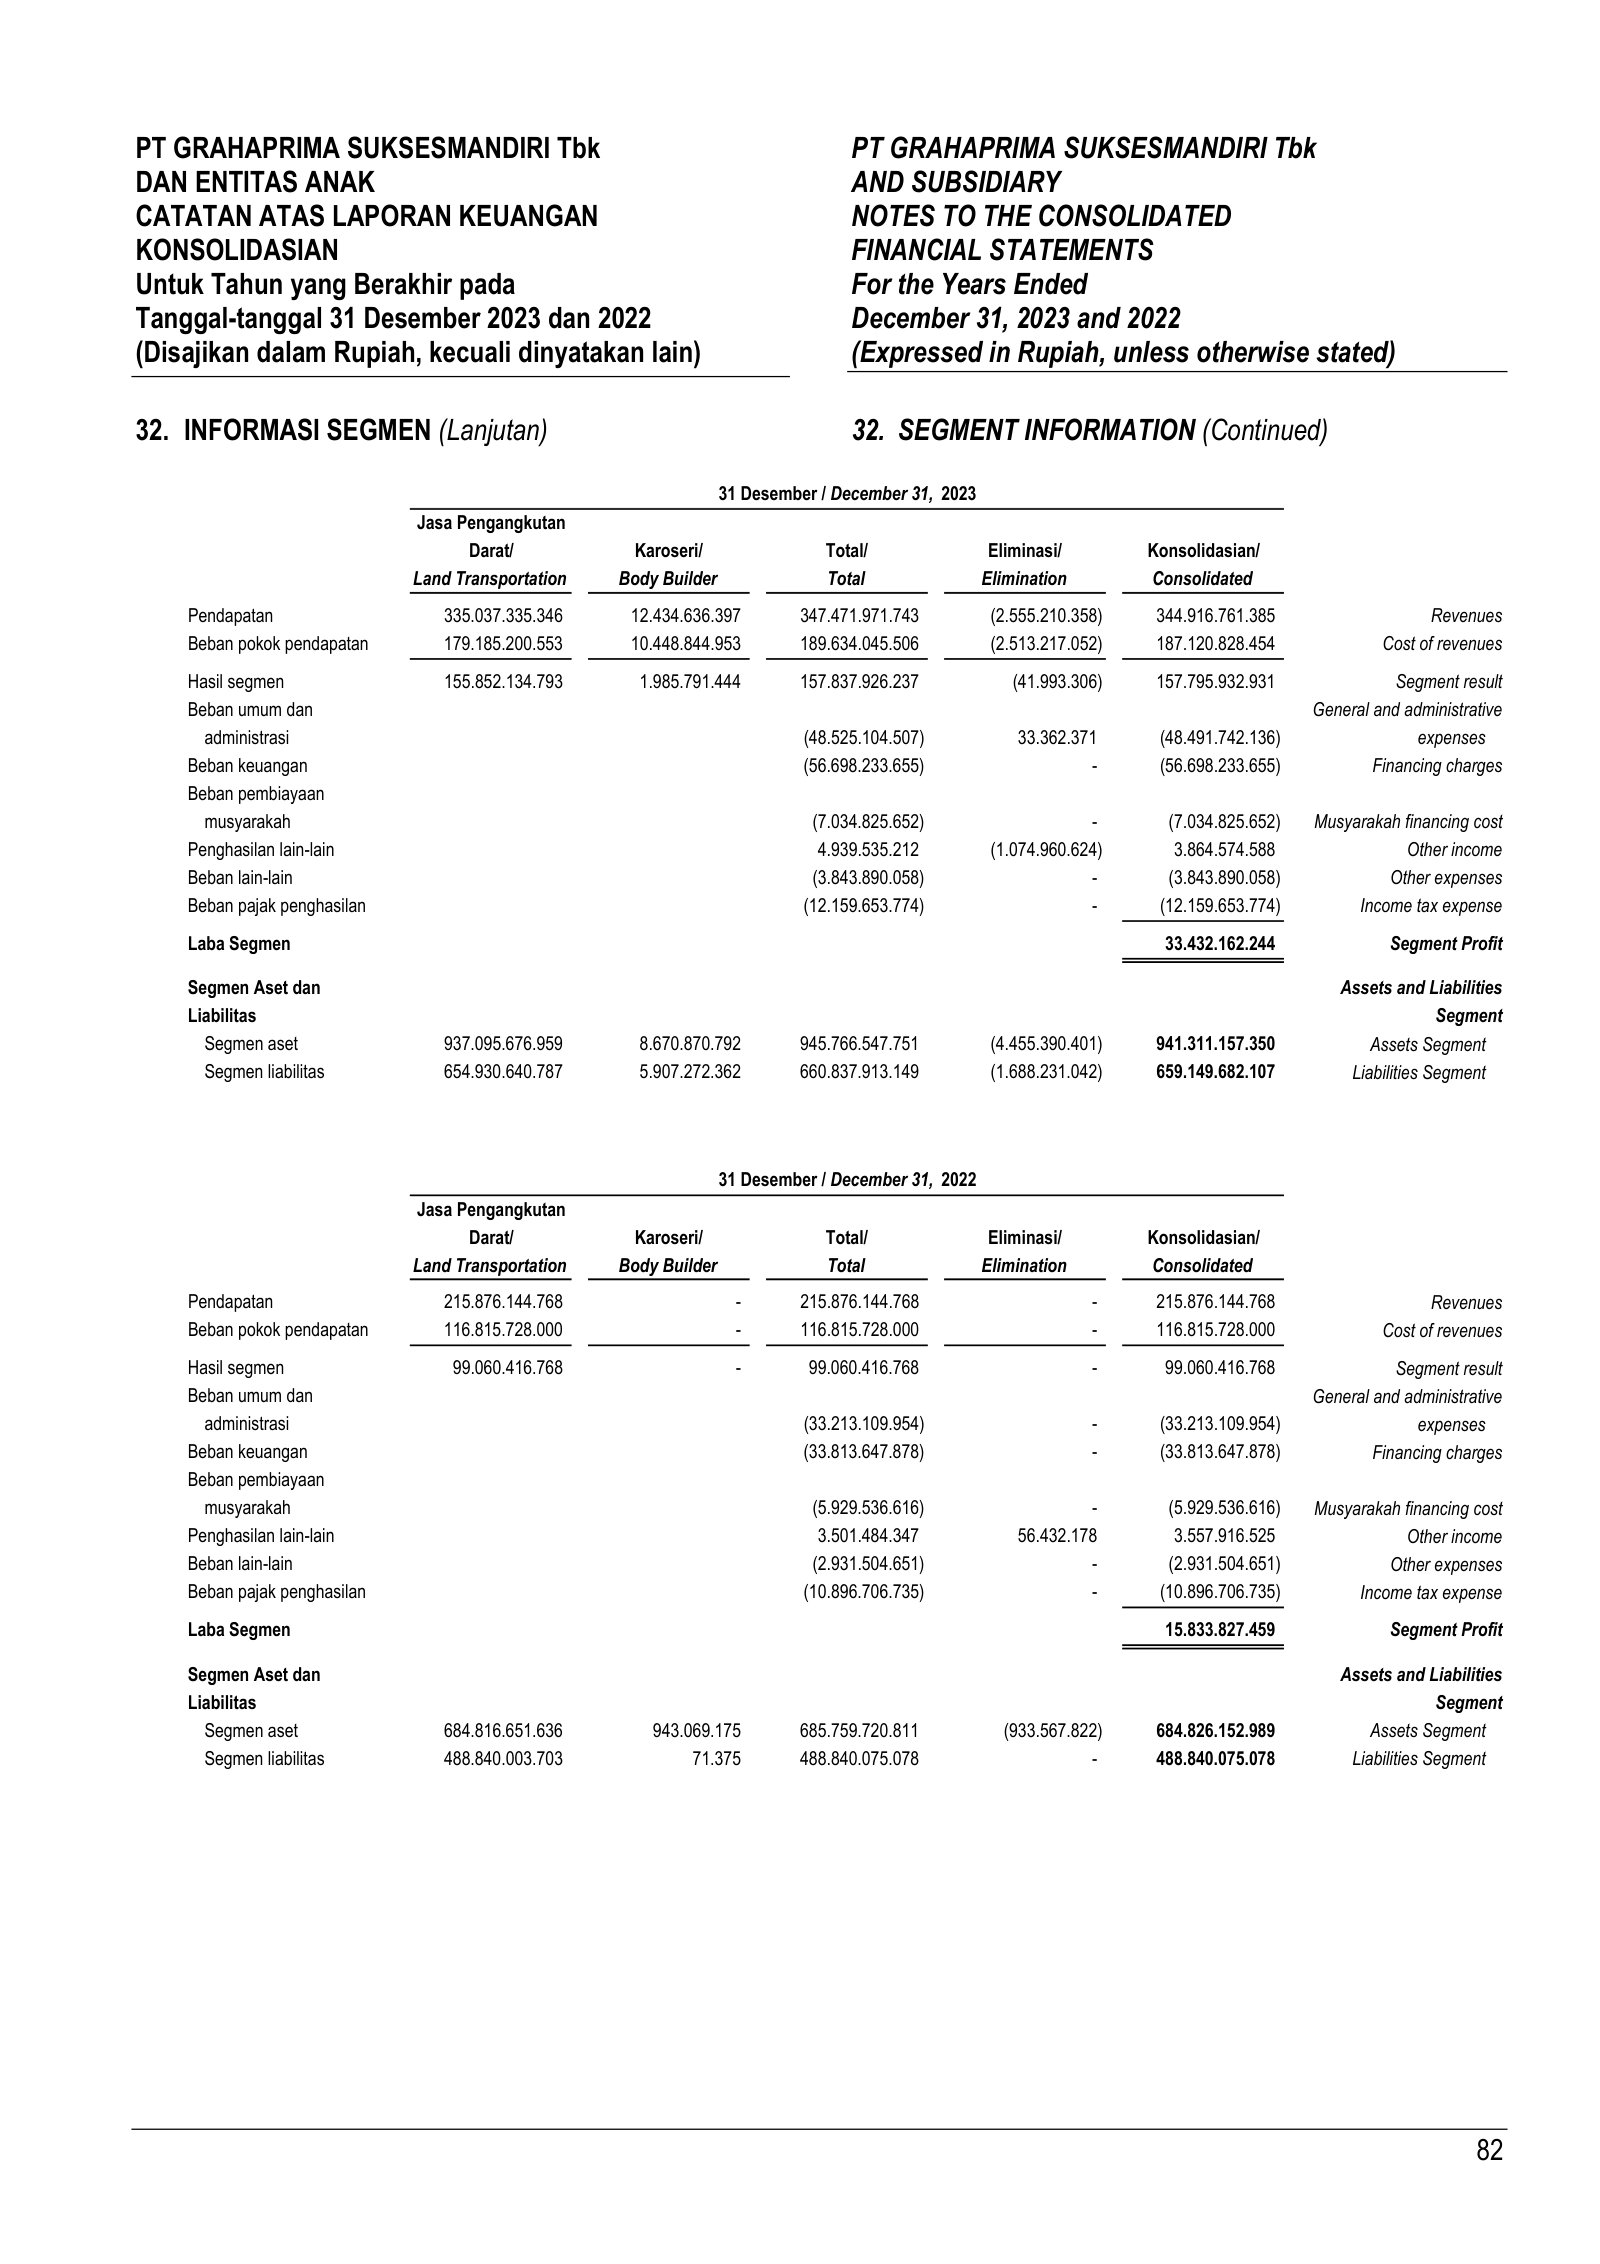
Shows the pre-transformation shape: coachbuilding just Rp12.4bn of Rp344.9bn revenue and an explicit statement of no supplier concentration.
FY2023: no single-party purchase exceeded 10% of consolidated net revenue (“no purchases from a single party exceeded 10%…”).
Tidak terdapat pembelian kepada satu pihak yang melebihi 10% dari total pendapatan neto konsolidasian.
p. 281 · Read in context →
More annual reports
PT Grahaprima Suksesmandiri Tbk (Graha Trans) — 2024 Annual Report — FY2024 · 266 pages · The intervening year (revenue Rp428.9bn) that bridges the FY2023 baseline and the FY2025 coachbuilding scale-up. · Open →
Competitors describe PT Grahaprima Suksesmandiri Tbk's market in their own filings and calls. These verified passages and visual pages show where their strategies meet, using source documents preserved in Sources.
PT Sidomulyo Selaras Tbk (SDMU)
The only IDX-listed road-freight peer with filings staged in this run, and the closest structural analogue: SDMU runs the same truck-and-trailer, pool-and-workshop FTL land-haulage model as GTRA out of overlapping Java pools (both operate a Bekasi base), and competes for the same drivers, fleet capacity and industrial-logistics contracts. It differs in end-market — SDMU specialises in liquid-chemical and hazardous/toxic-material (B3) cargo, where GTRA hauls general FMCG, e-commerce and automotive freight — so it is best read as an adjacent-niche competitor rather than a head-to-head one. The five other IDX transport peers named in the run's competitor screen (TRUK, BPTR, LAJU, MPXL, BLOG) had no documents staged and so cannot be exhibited here.
SDMU's stated strategic direction: scale the fleet and become a one-stop “DG-Chemical Transport” logistics platform for chemicals, crude oil and gas — a deliberate move up-market into specialised hazmat haulage rather than GTRA's general-cargo FTL lanes.
Entering 2026, the Company is optimistic about its business growth prospects, along with the increasing demand for logistics and transportation services for chemicals, crude oil, and gas. SDMU continues to strengthen its capabilities through fleet development and expansion, optimizing logistics management, improving hazardous and toxic materials (B3) storage services, and expanding its business reach. This aligns with the Company’s future business direction, which is to become a total logistics company for DG-Chemical Transport (one-stop logistics).
p. 87 · Read in context →
SDMU's own read of its market — intensifying competition in chemical transportation, defended through service quality and technology; the same margin-and-share pressure a small Indonesian road-freight operator faces alongside GTRA.
Furthermore, addressing the increasingly fierce competition in the chemical transportation industry requires the Company to continuously innovate and improve service quality. To maintain market share and meet customer expectations, the Company is focusing on human resource development and the implementation of the latest technology to enhance competitiveness.
p. 28 · Read in context →
More peer documents
SDMU FY2024 annual report — Directors' Report, p.29 — FY2024 · 277 pages · Quantifies SDMU's scale and fragility: net revenue Rp94.95bn (+3.4%) but net profit collapsing from Rp31.70bn to Rp1.51bn on fuel and fleet-maintenance costs — a micro-cap road-freight peer of a size comparable to GTRA. · Open →
Growth on Borrowed Money
PT Grahaprima Suksesmandiri (IDX: GTRA, brand Graha Trans) is a founder-controlled Indonesian trucking company that has grown revenue roughly 45% a year to Rp656bn and net profit nearly ninefold since 2021 — funded almost entirely by debt taken on to buy trucks. At Rp242 it trades near 6.6× earnings and 1.2× book. This report judges whether that growth is durable and self-financing enough to justify the price, given a balance sheet carrying Rp856bn of liabilities against Rp20bn of cash.
Revenue FY2025 (Rp bn)
Net profit FY2025 (Rp bn)
Market cap (Rp bn)
Founder ownership
Sources: FY2025 revenue and net profit from the FY2025 Annual Report, Consolidated Statement of Profit or Loss [1]; market cap = 1,894,375,000 shares at the 31 Jul 2026 close of Rp242 (derived from the share-capital note [2] and daily price data); founder ownership from Note 20 [3].
What Graha Trans does
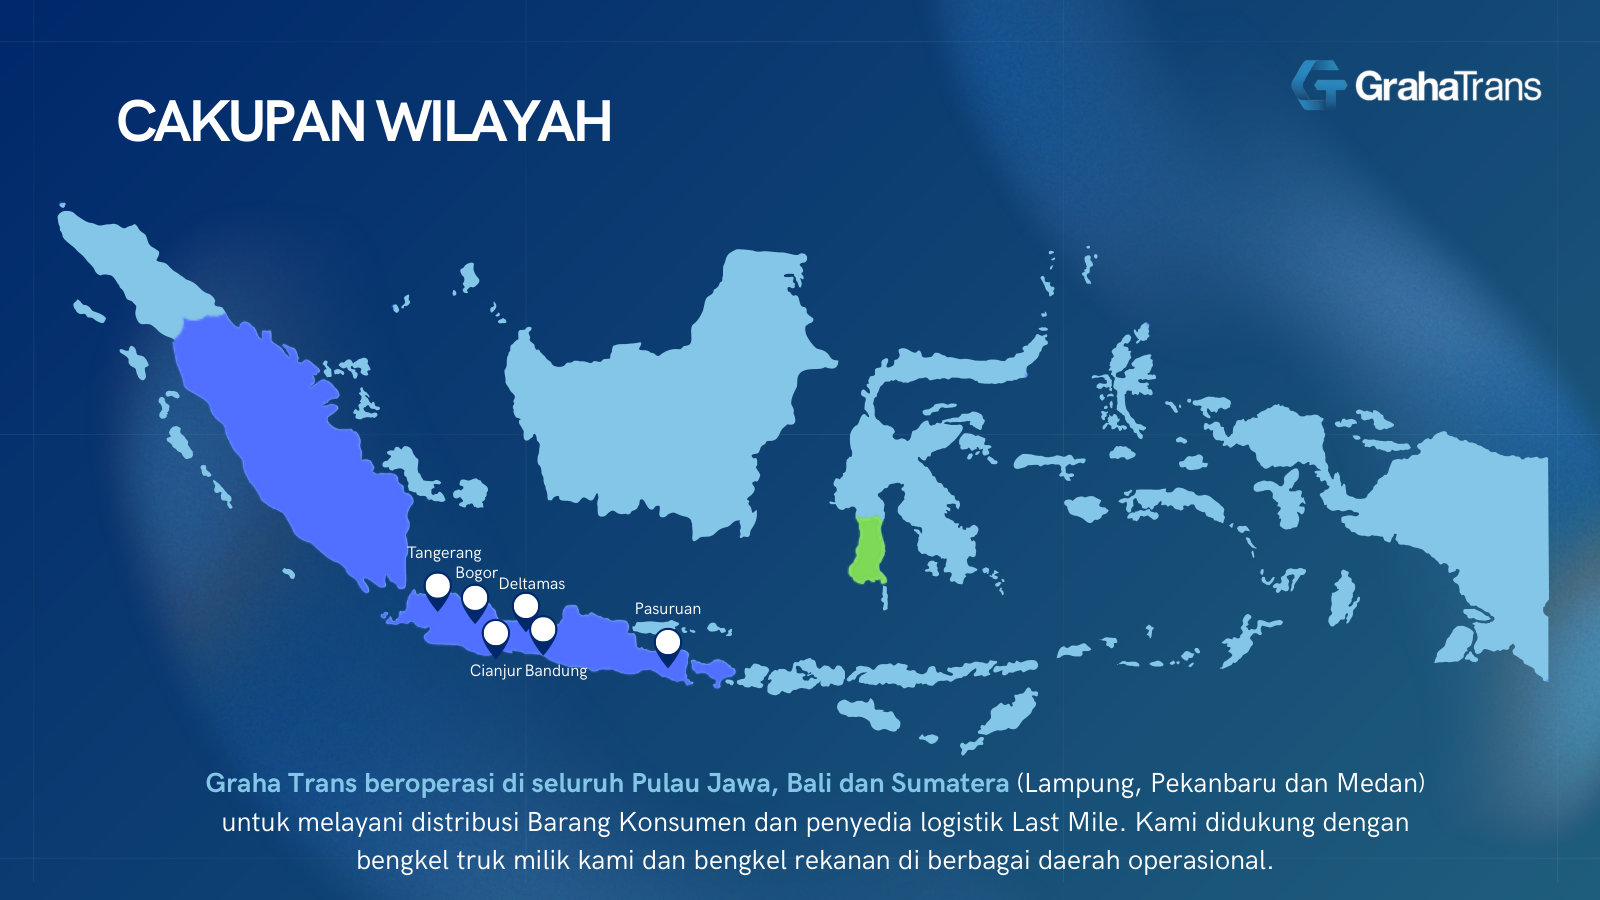
Graha Trans runs a full-truck-load (FTL) trucking and truck-rental operation, hauling freight between cities across Java, Bali and Sumatra from pools in Tangerang, Bogor, Deltamas (Bekasi), Pasuruan, Cianjur and Bandung. The disclosed fleet is about 1,200 trucks, dominated by wing-box and box types for intercity delivery, serving FMCG, e-commerce and last-mile logistics customers [4]. The company reports in two segments: Land Transportation — the core trucking service — and Karoseri (Body Builder), a subsidiary that builds and sells truck bodies. In FY2025, Land Transportation was Rp585.0bn (89%) of revenue and Karoseri Rp71.3bn (11%) [5].
Source: FY2025 Annual Report, Note 32 Segment Information [6].
The company is young as a public entity. It listed on the IDX on 30 March 2023, selling 378 million shares — 20% of its enlarged capital — and earmarked 64.8% of the net proceeds to buy 38 Hino trucks and the rest for working capital [7]. Buying trucks with raised capital and borrowed money is the whole model, and it shapes everything that follows.
The growth record
The top line has compounded at about 45% a year since 2021, and profit has grown faster still: net profit rose from Rp7.8bn in 2021 to Rp69.3bn in 2025, nearly ninefold, with FY2025 alone up 75% [8] [9].
Sources: FY2021–FY2023 from the FY2023 Annual Report, Financial Performance Highlights [10]; FY2024–FY2025 from the FY2025 Annual Report, Consolidated Statement of Profit or Loss [11].
This is genuine operating growth, not an accounting artifact: the revenue is billed to real logistics customers, and the fleet backing it has expanded in step. Two features of the customer base bear on how durable it is. The demand is anchored in FMCG and e-commerce distribution, which is structurally growing in Indonesia. But it is also concentrated: in the first nine months of 2025, two third-party customers — PT Nusantara Ekspres Kilat (Rp190.0bn) and PT Inbisco Niagatama Semesta (Rp111.8bn) — together supplied about two-thirds of revenue [12]. Whether that concentration is a risk or simply the shape of a young logistics book is a question for a later chapter.
Margins are narrowing as it scales
Underneath the headline growth, the unit economics have moved the wrong way. Gross margin fell from 48% in 2021 to 34% in 2025, with the sharpest drop last year: FY2025 cost of revenue rose 75% while revenue rose 53% [13].
Source: derived from reported revenue, gross profit and net profit — FY2023 Annual Report [14] and FY2025 Annual Report [15].
Two forces sit behind the erosion. The lower-margin Karoseri body-building line grew from Rp12bn in 2023 to Rp71bn in 2025, diluting the blended gross margin; and the core trucking line's own costs — transport, tyres, depreciation on a growing fleet — rose faster than pricing [16]. Notably, net margin did not follow gross margin down — it rose to 10.6% in FY2025 from 9.2% — because costs below the gross line grew far more slowly than revenue [17]. That divergence between a falling gross margin and a rising net margin is one of the more important things to reconcile about this company, and it belongs to the economics chapter.
The balance sheet behind the growth
Every truck is bought with borrowed money, so the balance sheet grows with the fleet. Total liabilities reached Rp856bn at end-2025 against Rp387bn of equity — about 2.2× — after rising 28% in the year, mostly bank loans, consumer-financing and musyarakah facilities used to acquire trucks [18].
Sources: FY2022–FY2023 from the FY2023 Annual Report, Financial Performance Highlights [19]; FY2024–FY2025 from the FY2025 Annual Report, Consolidated Statement of Financial Position [20].
The figure a bankruptcy-averse reader will notice first is cash. GTRA ended 2025 with Rp19.7bn of cash against long-term borrowings of roughly Rp615bn — cash covers about 3% of long-term debt [21]. A leveraged fleet financed on thin cash can be perfectly sound if operating cash flow reliably services the debt, and dangerous if it does not. Which of those is true here — whether the business self-funds its interest and amortisation — is the balance-sheet question the report has to answer, and it is the crux for an investor who wants the chance of bankruptcy near zero.
Who owns it
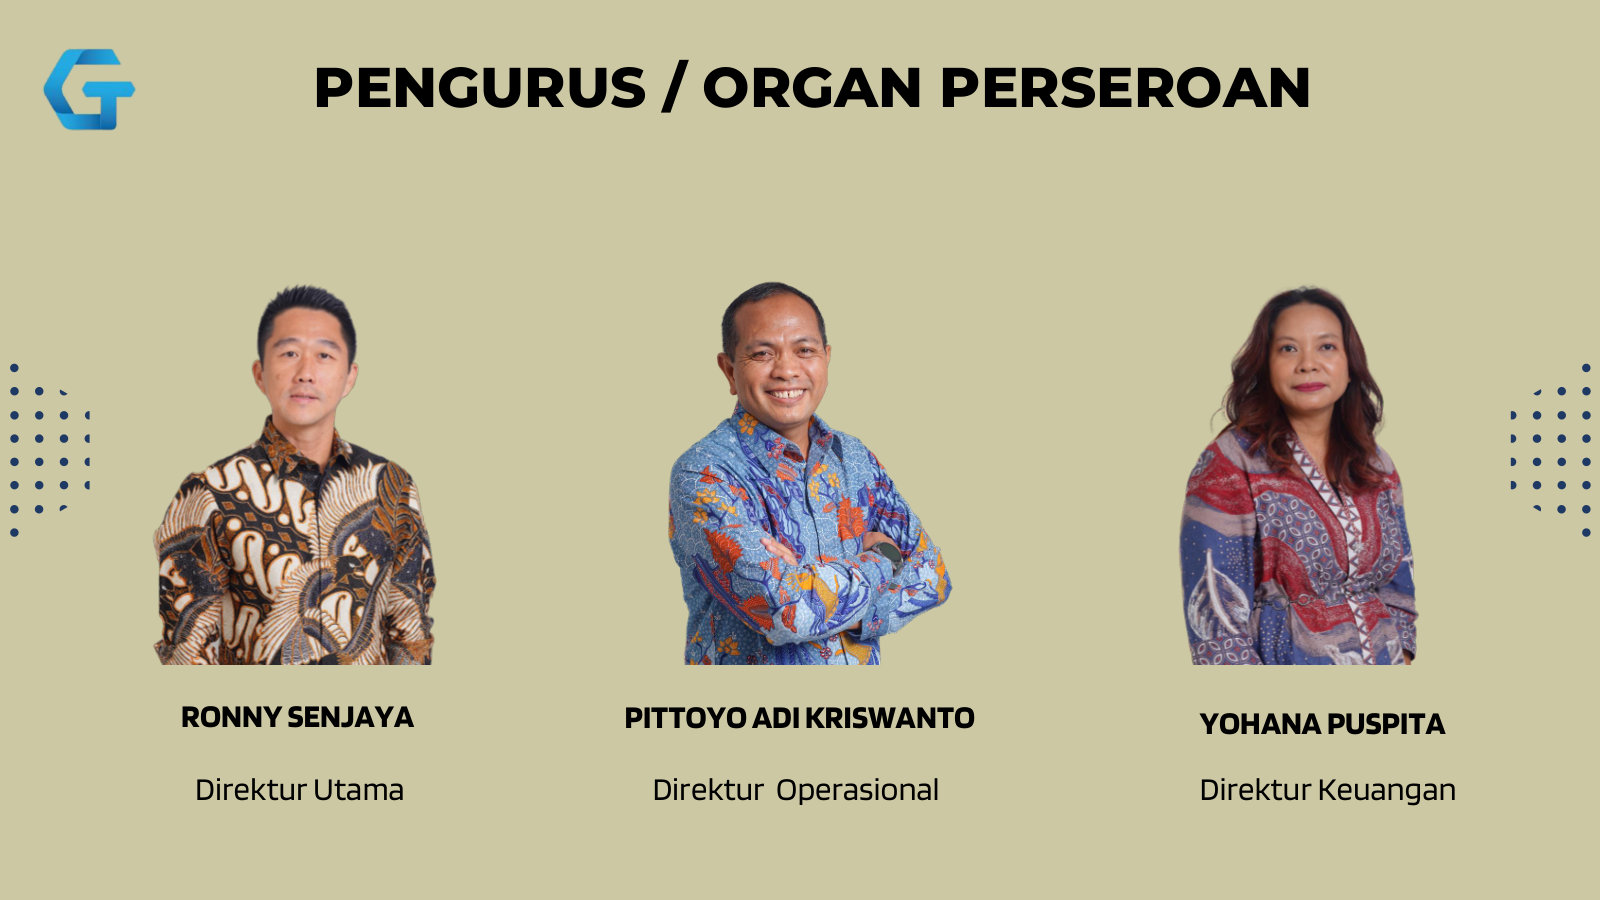
GTRA is unusually closely held. Two founder holding companies — PT Adika Eka Putra and PT Trimulti Adinata Perkasa — own 34.95% each, and the two principals, Ronny Senjaya and Ardi Supriyadi, hold a further 5.05% each directly, leaving the public with 20% [22]. Both holding companies trace up to Ronny Senjaya and Ardi Supriyadi 50/50, so the two founders control roughly 80% of the company; the FY2023 report names Ronny Senjaya as the ultimate beneficial owner [23].
Source: FY2025 Annual Report, Note 20 Share Capital [24].
For a reader who prizes owner-operators with skin in the game, this is the attractive side of the story: management's wealth is the equity. The pay is modest and cash-only — aggregate FY2024 board remuneration was Rp3.6bn (Rp1.32bn to commissioners, Rp2.30bn to directors), with no stock or option awards [25]. Returns to shareholders have begun modestly too: a Rp1.82-per-share cash dividend on FY2024 earnings, roughly a 9% payout, leaving the bulk of profit retained to fund the fleet [26]. The flip side of 80% control and a 20% float is thin liquidity and minority-holder dependence on the family — a governance thread for later.
What the stock has done
The price feed available for this report begins in February 2026, so it captures the recent de-rating rather than the full post-IPO history. Within that window the shares traded between Rp161 and Rp378 and closed 31 July 2026 at Rp242, about 36% below the February high, after a June trough near Rp160 and a partial recovery (derived from daily price data).
Source: daily closing prices (derived from price data; feed begins Feb 2026).
No sell-side analyst covers the stock — there is no published consensus target or forward estimate, and the only forward figure on record is management's own revenue guidance. At Rp242 the market caps the business at about Rp458bn, roughly 6.6× trailing earnings and 1.2× book — cheaper than its own growth rate. What sits behind that discount — the leverage, the customer concentration, the margin trend, or simply the illiquidity of a 20%-float micro-cap — is the work of the chapters that follow.
The question this report answers
Put plainly: whether GTRA is worth more than its depressed ~6.6× earnings price turns on two competing readings: that its debt-funded fleet growth is durable and self-financing enough to justify a re-rating, or that the leverage buying every truck endangers the equity faster than profit can compound. The bull case is a founder-owned operator compounding revenue and profit at rare rates, priced below book after a sharp sell-off. The bear case is a thin-margin, highly-leveraged fleet with almost no cash buffer and a concentrated customer book, where a single bad year for freight demand or credit availability could threaten the equity itself. Every chapter that follows is a test of one side of that trade-off.
Financing the Fleet
Graha Trans throws off enough cash to service its debt: 2025 operating cash flow of Rp92.9 billion was struck after Rp65.1 billion of interest, covering the finance bill 2.4 times [1]. That pushes near-term insolvency risk down. But the reported Rp107.6 billion of "debt repayment" is not deleveraging: the fleet grew on Rp240.8 billion of new lease and bank debt booked outside the cash-flow statement, and interest-bearing debt still rose to Rp727.9 billion. The business self-services its debt; it does not self-fund its growth.
Three years, three different cash-flow signatures
The cash-flow record since the March 2023 listing splits cleanly into three phases, and reading them in order is what the balance-sheet snapshot in Growth on Borrowed Money could not show.
Consolidated statements of cash flows, FY2023 Annual Report p.80, FY2024 Annual Report p.63, FY2025 Annual Report p.69 (figures in Rp billion).
2023 was the build. The company spent Rp209.6 billion on investing — mostly truck acquisitions and land down-payments — and funded it with Rp200.1 billion of financing inflows, of which Rp126.4 billion was fresh musyarakah (Islamic) financing [2]. This is the year the leverage in the thesis was laid down.
2024 was digestion. Capex fell sharply, financing turned to a Rp28.3 billion net outflow as the company began repaying, and operating cash flow dipped to Rp33.9 billion — management attributed the drop to extended customer payment terms and higher supplier and payroll outlays [3].
2025 was the cash surge. Operating cash flow nearly tripled to Rp92.9 billion, investing swung to a Rp13.1 billion inflow, and financing showed Rp107.6 billion going out the door [4]. Taken at face value, 2025 looks like a company that has turned the corner and is paying its debt down. Two of those three lines are less flattering than they read.
Operating cash flow is real, and it clears interest
The genuinely good line is the operating figure itself, and it is not a working-capital mirage. Cash receipts from customers were Rp627.8 billion against Rp656.3 billion of booked revenue [5][6] — the company collected 96% of what it invoiced. Trade receivables did rise, but more slowly than sales: days sales outstanding fell from roughly 131 days at end-2024 to 107 days at end-2025 [7]. Collections tightened; they were not stretched to manufacture the number.
Because interest is settled in cash and classified inside operating activities, the reported operating figure already carries the full finance burden. On the income statement, finance charges of Rp46.1 billion plus musyarakah financing cost of Rp19.0 billion sum to Rp65.1 billion [8] — the same Rp65.1 billion paid in cash [9]. There is no gap between accrued and paid interest to worry about.
Against that bill, coverage improved materially in 2025 and both cash and earnings measures agree.
EBIT / interest, FY2025
Cash-flow / interest, FY2025
Operating profit of Rp156.3 billion — gross profit of Rp224.3 billion less Rp68.1 billion of general and administrative expense — covered the Rp65.1 billion finance bill 2.4 times, up from 1.8 times in 2024 [10][11]. Measured on cash — operating cash flow before interest of Rp158.1 billion over Rp65.1 billion paid — the ratio is the same 2.4 times, versus a thin 1.5 times in 2024. For a reader whose first fear is bankruptcy, this is the reassuring half of the chapter: the trucks earn enough to pay the lenders, with a widening margin.
EBIT is gross profit less G&A; cash coverage is operating cash flow before interest divided by interest paid; FY2025 Annual Report pp.263–264, cash statement p.196.
The "deleveraging" is an accounting artefact
Now the line that reads better than it is. Financing activities showed Rp107.6 billion leaving the company in 2025, which invites the conclusion that debt is being retired. Yet interest-bearing debt rose over the year, from Rp578.6 billion to Rp727.9 billion — up Rp149.4 billion [12]. Both statements are true at once because most of the fleet Graha Trans added in 2025 never passed through the cash-flow statement.
The supplementary note is explicit: the company acquired Rp240.8 billion of fixed assets funded entirely by new debt — Rp193.3 billion through consumer-financing (lease) payables and Rp47.5 billion through a bank loan [13]. None of that is a cash outflow, so it is invisible in the Rp13.1 billion investing figure and the Rp107.6 billion financing figure. The reconciliation is the chapter in one table:
Interest-bearing debt from FY2025 Annual Report p.263; non-cash additions from Note 33, p.264; residual is a balancing item across cash draws, the new Rp12.7 bn overdraft and repayments.
Debt-to-equity, measured on interest-bearing debt, edged up from 1.81x to 1.88x despite a year of retained earnings adding to equity [14]. The pattern is a treadmill, not a paydown: operating cash amortises the existing lease and loan principal, while each replacement truck arrives on a fresh finance lease. It is a workable model — asset-backed lending against revenue-generating trucks is ordinary in this industry — but it means the leverage is refinanced and extended, not shrinking. Anyone reading the financing line as balance-sheet repair is reading it wrong.
One related item belongs in the same frame: Rp23.4 billion of cash left the company in 2025 as advances to related parties, booked as other receivables, versus Rp1.7 billion the year before [15]. In a year when every rupiah of financing headroom mattered, that outflow is worth tracking in the deeper governance work this report still owes.
The liquidity cushion is thinner than the balance sheet shows
The reassurance from coverage comes with a caveat the headline cash balance hides. The Rp19.7 billion of cash reported at end-2025 is a gross figure; the cash-flow statement reconciles to Rp7.0 billion after netting a new Rp12.7 billion bank overdraft the company drew during the year [16]. Real spendable cash is roughly a third of the stated number.
That cash position sits against what comes due inside twelve months.
Contractual maturity of financial liabilities, excluding future interest; FY2025 Annual Report p.262.
Rp113.2 billion of interest-bearing debt falls due within a year, alongside Rp36.1 billion of trade payables [17]. Net cash of Rp7.0 billion covers about a sixteenth of the near-term debt maturities alone. The company is not funded by a cash buffer; it is funded by the next twelve months of collections and by lenders continuing to roll and extend credit — a point management effectively concedes, describing liquidity as managed through cash-flow projections, loan-maturity schedules and available committed facilities rather than through cash on hand [18].
That structure is only as safe as the cash flow feeding it, which draws the two risks together. Operating cash flow of Rp92.9 billion clears the Rp113.2 billion of near-term maturities only with refinancing of the rolling balance; a sustained drop in collections would hit the tightest part of the structure first. And collections are concentrated — the top two customers were roughly two-thirds of nine-month 2025 revenue, a demand-durability question this report has flagged but not yet examined. The 2025 investing inflow leans on the same fragility from a different angle: it turned positive only because the company sold Rp97.1 billion of used trucks, against Rp60.5 billion of cash purchases [19]. Fleet-renewal proceeds of that size depend on a liquid secondhand-truck market; in a freight downturn, used-truck values and customer receipts would soften together, exactly when lease payments and maturities keep their schedule.
What this settles, and what it turns on
On the evidence, the immediate bankruptcy fear is not supported: 2025 operating cash flow covers interest 2.4 times and is improving, interest is fully paid in cash, and collections are tightening rather than slipping. The strongest fact against that comfort sits in the same statements — interest-bearing debt rose Rp149.4 billion to Rp727.9 billion even as the financing line implied repayment, because the fleet is funded by lease debt that never touches cash flow, and the spendable cash cushion is Rp7.0 billion against Rp113.2 billion of maturities inside a year. The read would change if operating cash coverage slipped back toward the 1.5 times of 2024, if the used-truck disposal channel dried up, or if lenders tightened the finance-lease terms the model depends on. The number to watch each period is operating cash flow before interest against the next twelve months of debt maturities; as long as the first comfortably exceeds the second, the model holds.
Two Customers
The operating cash flow that services GTRA's debt is collected from a customer book that is narrowing, not broadening. Two customers supplied 64.5% of FY2025 revenue, up from 38% two years earlier, and one of them — the courier arm of Shopee — generated more than two-thirds of all revenue growth since 2023 [1]. Both buy on one-year contracts. The self-funding case built in Financing the Fleet is funded by collections from those two customers.
The book has narrowed to two names
The filings disclose, each year, the customers that individually exceed 10% of consolidated revenue. Read across FY2023 to FY2025, the disclosure tells a consistent story: the two largest accounts have gone from a little over a third of the business to nearly two-thirds.
Source: customers exceeding 10% of net revenue, FY2025 Annual Report Note 24 [2] and FY2024 Annual Report Note 24 [3]; denominators from reported revenue [4][5].
In FY2025, PT Nusantara Ekspres Kilat billed Rp269.1 billion and PT Inbisco Niagatama Semesta Rp154.1 billion — together Rp423.2 billion, or 64.5% of the Rp656.3 billion top line [6][7]. Two years earlier the same two names were Rp132.4 billion of Rp344.9 billion, 38.4%, and a third customer, PT Global Jet Cargo, was itself above the 10% line [8][9].
Top-2 share of FY2025 revenue
Largest customer (Shopee Express)
Largest customer, revenue vs FY2023
Source: derived from Note 24 revenue-by-customer disclosure, FY2025 and FY2024 Annual Reports [10][11].
Where the growth came from
GTRA's revenue near-doubling to Rp656.3bn was driven 68% by one customer — Shopee's courier arm Nusantara Ekspres Kilat (Rp269.1bn, 41% of FY2025 revenue) on one-year rolling contracts — while the incremental capacity to serve it was bought largely from commonly-controlled affiliate PT Gama Putra Sukses Prima, to which GTRA paid Rp245.0bn in FY2025, 82.5% of its Rp296.9bn haulage line and 38% of total revenue. Nusantara Ekspres Kilat billed Rp57.6 billion in FY2023, Rp101.1 billion in FY2024, and Rp269.1 billion in FY2025 — a 4.7-fold rise in two years [12][13]. Of the Rp311.4 billion by which revenue grew over those two years, this single customer supplied Rp211.5 billion — 68% of the entire increase. Add Inbisco and the two together account for 93% of all revenue growth since 2023.
Source: revenue-by-customer disclosure and reported revenue, FY2025 and FY2024 Annual Reports [14][15]; rest of book is total revenue less the two named customers.
The rest of the book — everything outside the top two — grew from Rp212.5 billion to Rp233.1 billion, up less than 10% across two years in which total revenue nearly doubled [16]. The trucking, rental, and body-building operations described in Growth on Borrowed Money have been roughly flat outside these two relationships. The debt-funded fleet expansion and the two-customer expansion are, to a first approximation, the same event.
Who the two customers are
The two names carry very different demand drivers, and the corpus plus public records identify both.
Nusantara Ekspres Kilat is the Indonesian courier arm of Shopee — the company operates as Shopee Express (SPX), a subsidiary of PT Shopee International Indonesia (part of Sea Limited), per public company records. GTRA's relationship with it is a fleet-rental and on-call transport arrangement: GTRA supplies vehicles to the areas and routes Nusantara Ekspres Kilat specifies [17]. In substance, GTRA's largest exposure is to Shopee's parcel volumes in Indonesia — an e-commerce logistics tailwind, but also a customer with the scale to reprice, in-source, or reallocate the trucks it rents.
Inbisco Niagatama Semesta is part of the Mayora Group, one of Indonesia's larger fast-moving consumer-goods groups. GTRA's FY2021 transportation agreement is with the Mayora Group as a whole — it names Inbisco alongside Mayora Indah, Torabika, Tirta Fresindo, and four other Mayora entities [18]. This is staples-freight demand: high-volume, comparatively stable, and less cyclical than parcels.
The mix is worth holding in view. One anchor rides Indonesian e-commerce; the other rides packaged-food distribution. That is more diversification than a single-sector book — but both remain single counterparties, and both are large enough that GTRA is a price-taker in the negotiation.
Both relationships run on short contracts
The concentration would matter less if these were multi-year, take-or-pay commitments. They are not. Both anchor relationships sit on one-year agreements that have been extended repeatedly, one amendment at a time.
Watch item: at 30 September 2025, the Mayora Group transportation agreement had lapsed to its stated term and the renewal was "still in process"; the Nusantara Ekspres Kilat arrangement was extended only to 10 June 2026.
The Mayora Group agreement, signed on 1 July 2021, carries a one-year term extendable by mutual agreement; it has been renewed several times [19]. As of the September 2025 interim statements it had been extended to 30 September 2025, with the further amendment "still in process" at the reporting date — the contract behind roughly a quarter of revenue was, at that moment, in a renewal gap [20]. The Nusantara Ekspres Kilat arrangement, which began as a February 2022 vehicle rental and became an on-call service confirmation in April 2024, had been amended to run only to 10 June 2026 [21]. The FY2025 annual report shows the Mayora term subsequently extended to 31 October 2026 [22], so the renewals have kept coming — but the cadence is annual, and the renewal risk is not hypothetical: it is a live line item in the filings.
Churn at this scale is not theoretical
The clearest evidence that a large account can leave sits inside GTRA's own disclosure. PT Global Jet Cargo billed Rp45.7 billion in FY2023 — 13.3% of revenue, above the 10% threshold — then fell to Rp19.3 billion in FY2024 and out of the top ranks entirely by FY2025 [23][24]. A customer worth an eighth of the business two years ago is now immaterial.
The reading cuts both ways. It shows that a top-three account can shrink by 90% in two years — the downside case for the anchors is real and has precedent in this very book. It also shows that GTRA replaced that lost revenue and grew regardless, because Nusantara Ekspres Kilat was scaling faster than Global Jet Cargo was fading. The concentration is a genuine risk; it is not evidence that the company cannot win or replace volume.
Why this bears on the debt
The link back to solvency runs through the balance sheet. Financing the Fleet showed that GTRA services its debt out of collections, not out of a cash balance — and those collections are as concentrated as the revenue. At the end of FY2025, Nusantara Ekspres Kilat owed Rp64.3 billion and Inbisco Rp39.0 billion, together Rp103.4 billion, or 58% of the Rp178.0 billion of gross third-party trade receivables [25]. Nine months earlier the same two names carried Rp132.4 billion of receivables, 68% of the third-party total [26].
Source: FY2025 Annual Report, Note 24 Revenues [27] and Note 5 Trade Receivables [28]; sector identification per contract note and public company records.
The liquidity picture puts that in scale: net of the Rp12.7 billion overdraft it drew late in the year, GTRA held about Rp7.0 billion of cash at end-2025 (Financing the Fleet). A single customer's receivable is roughly nine times the entire net cash cushion. That is what customer concentration means for a business that services asset-backed debt from operating cash flow: a payment delay or a lost renewal at either anchor is felt first in the ability to meet lease and interest obligations, not in a slow erosion of the income statement.
The durability of GTRA's debt-funded model is most sensitive to these two relationships — above all the Shopee Express account, which is both the growth engine and a one-year contract with a counterparty that has its own logistics ambitions. The strongest fact on the other side is that the book has absorbed a 90%-scale customer loss before and grew through it. What would change the read is concrete: a multi-year or take-or-pay term on either anchor, or a third relationship scaling toward 10% of revenue, would materially widen the base the leverage rests on. Neither is visible in the filings yet.
Related-Party Flows
GTRA's revenue near-doubling to Rp656.3bn was driven 68% by one customer — Shopee's courier arm Nusantara Ekspres Kilat (Rp269.1bn, 41% of FY2025 revenue) on one-year rolling contracts — while the incremental capacity to serve it was bought largely from commonly-controlled affiliate PT Gama Putra Sukses Prima, to which GTRA paid Rp245.0bn in FY2025, 82.5% of its Rp296.9bn haulage line and 38% of total revenue. [1] [2] [3].
The single-sourcing works in two directions. The NEK/Shopee line is 41% of FY2025 revenue on a contract amended only through 10 June 2026 [4], so a non-renewal would remove the largest block of the top line at once; on the supply side, a 10% repricing of the affiliate haulage would cost Rp25.0bn, equal to 27.5% of the Rp90.9bn FY2025 pre-tax profit — the sensitivity worked through in The Margin Math. Against that, the Shopee arrangement has been renewed repeatedly, and the book has already absorbed the loss of PT Global Jet Cargo, a customer worth 13% of FY2023 revenue, without a break in revenue [5].
GTRA is 80% owned by the founding group, and in 2025 the same family sat on both sides of its books: Rp249.6bn — 38% of revenue — was paid to a commonly-controlled hauler, and Rp25.0bn of company cash was lent up to the ultimate parent. Both flows are disclosed and audited, and management calls them arm's-length. But they mean the reported Rp69.3bn profit and the thin cash servicing the debt cannot be read at face value without a governance discount.
The control structure
Two holding companies own the bulk of GTRA. PT Adika Eka Putra and PT Trimulti Adinata Perkasa each hold 34.95%; founders Ardi Supriyadi and Ronny Senjaya hold 5.05% apiece; the public float is 20.00% [6]. Above that sits PT Dwikarya Semesta Investama, which the financial statements name as the Parent Entity of the Company [7].
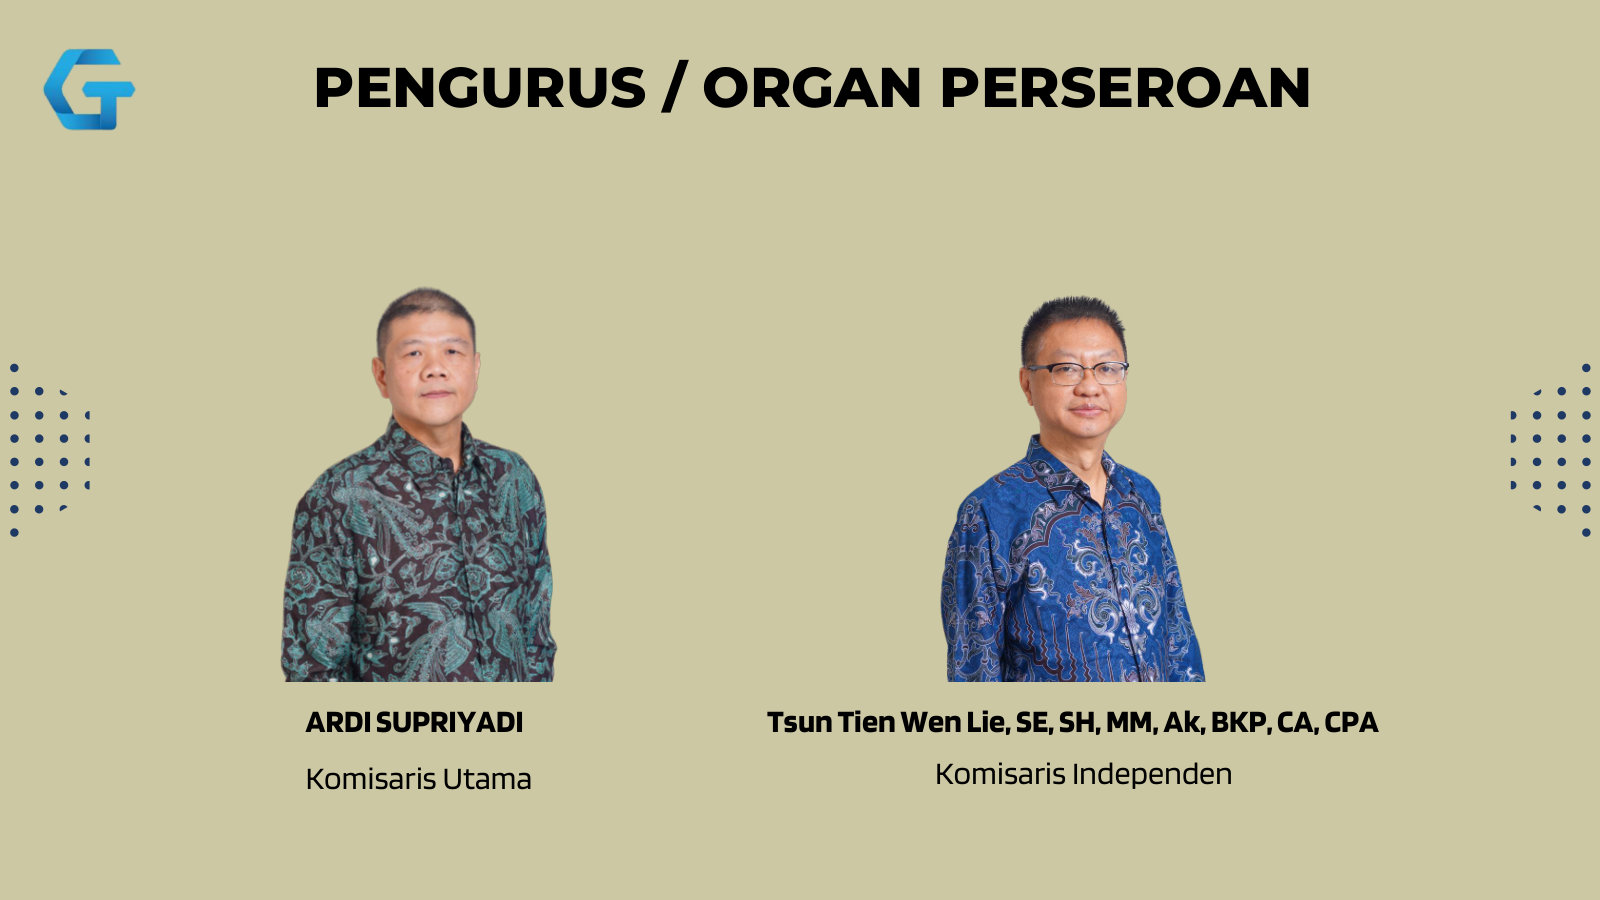
Oversight of that structure rests on a two-person Board of Commissioners: Ardi Supriyadi as President Commissioner and Tsun Tien Wen Lie as the sole Independent Commissioner [8]. The President Commissioner is not independent of the counterparties: his disclosed roles include Commissioner of PT Gama Putra Sukses Prima, Commissioner of PT Adika Eka Putra (a 34.95% shareholder), and a seat at PT Dwikarya Semesta Investama [9]. The person overseeing the related-party transactions on GTRA's board also sits on the boards of the counterparties to them.
The cost line
The largest single line in GTRA's cost of revenue is transportation expense — the cost of actually moving freight — which rose to Rp296.9bn in 2025 from Rp163.8bn a year earlier [10]. Inside that line, Rp245.0bn was paid to PT Gama Putra Sukses Prima, an entity under common control — roughly 82.5% of the haulage bill — with total related-party purchases of Rp249.6bn, equal to 38.0% of revenue [11].
This is new. Related-party purchases were Rp2.6bn in 2023 [12] and Rp36.6bn in 2024, before reaching Rp249.6bn in 2025 [13]. Measured against total cost of revenue of Rp432.0bn, the affiliate share went from 1.4% to 14.8% to 57.8% in three years [14].
Related-party purchases, almost entirely from commonly-controlled PT Gama Putra Sukses Prima [15], [16].
The timing lines up with the demand story told in Two Customers: as the Shopee-driven volume ramped, GTRA increasingly fulfilled it not with its own ~1,200 trucks but by buying haulage capacity from a family-controlled operator. How that mix shift moves the gross margin is decomposed in The Margin Math. It also means a large and rising share of revenue passes straight through to an affiliate whose own margin on that work the minority shareholder cannot see. Whether the Rp245.0bn was priced fairly is not verifiable from the corpus: the filings state only that related-party transactions are carried out "on terms that are equivalent to those applicable in fair transactions" [17], an assertion by management, not an independent finding.
Cash flowing up to the parent
On 8 October 2025 GTRA agreed to lend Rp25,000,000,000 to its parent, PT Dwikarya Semesta Investama, at 9% per annum, maturing 7 October 2026, with an interest grace period through 31 December 2025 [18]. That single loan drove total other receivables from related parties from Rp1.8bn to Rp25.3bn over the year [19] — the cash leakage first surfaced, unnamed, in Financing the Fleet.
The Rp25.0bn is large against GTRA's own resources. It equals 36% of the Rp69.3bn of net profit the company earned that year, and roughly 3.6 times the ~Rp7bn of cash the business held net of a new overdraft. And the carry runs the wrong way: GTRA's own 2025 finance bill was Rp29.8bn on consumer financing and Rp13.7bn on bank loans [20], so a debt-funded, thinly-capitalised company lent to its parent at 9% — and, because of the grace period, earned no interest on the loan at all in 2025.
GTRA's related-party cash flows run consistently outward, toward the controlling family. Set beside what the minority received, the contrast is stark: GTRA paid Rp249.6bn to an affiliate for haulage and lent Rp25.0bn up to the parent, while the total cash dividend to all shareholders on FY2024 earnings was Rp3.45bn (Rp1.82 per share) [21] — of which the 20% public float received about Rp0.7bn.
Affiliate purchases and the parent loan dwarf the dividend paid to outside holders. Revenue billed to affiliates from Note 24; other figures as cited above [22], [23].
The alignment
None of this is hidden, and the reader's preference for founder alignment is not misplaced here. Management holds 80% of the equity and takes very little out in cash: total key-management remuneration was Rp4.3bn in 2025, up from Rp3.6bn, all in short-term cash with no equity awards [24] — about 6% of net profit. A controlling family paid modestly in salary, with the bulk of its return riding on the same shares the minority owns, is the skin-in-the-game the case is built on. The related-party flows are the cost of that structure, not evidence that it is being looted: the loan to the parent carries a stated rate and a fixed one-year maturity, and subcontracting haulage is ordinary in an asset-constrained trucking business that discloses only ~1,210 owned trucks against fast-growing volume.
The independent check on it all is thin, though. GTRA's auditor issued a clean opinion but singled out one Key Audit Matter — revenue recognition and the recoverability of trade receivables, explicitly including those arising from transactions with related parties [25]. The area the auditor judged to carry the most estimation risk is the same area where the family controls the counterparties.
The judgment here is narrow: this is a governance discount, not a governance scandal. Every flow is disclosed, quantified and audited, and the controlling family's 80% stake aligns it with minority holders on the equity value even as the related-party plumbing routes profit and cash through entities the minority cannot see into. For a buyer demanding a margin of safety, the reported Rp69.3bn of profit and the Rp19.7bn of gross cash [26] should both be taken with a haircut for that opacity. The strongest fact against the discount is the alignment itself — a founder who owns 80% and pays himself little has limited incentive to hollow out the listed vehicle. What would narrow the discount: the Rp25.0bn parent loan repaid on schedule in October 2026, independent confirmation that the Gama Putra haulage is priced at market, and the affiliate's share of the cost base levelling off rather than continuing to climb. What would widen it: the loan rolled or grown, or the related-party purchase share pushing higher still.
The Margin Math
GTRA's net margin rose from 9.2% to 10.6% in FY2025 even as gross margin fell 8 points to 34.2% (related-party bought-in haulage reaching Rp249.6bn, 57.8% of cost of revenue) only because financing cost fell to a 9.9%-of-revenue trough, yet Rp240.8bn of new debt-funded fixed assets added late in the year carry ~Rp25-29bn of annual interest (28-32% of pre-tax profit) and a 10% affiliate-haulage repricing would cost Rp25.0bn (27.5%) — so the offset that holds the margin up is itself about to erode. [1] [2]
The reported improvement reads like a business getting stronger; the mechanics say otherwise. A full year of interest on the Rp240.8bn of trucks added late in FY2025 runs to roughly Rp25bn to Rp29bn — 28-32% of the Rp90.9bn pre-tax profit — and the 9.9%-of-revenue financing ratio that flattered net margin is a trough against 16.3% a year earlier. Against that, the administrative operating leverage behind part of the improvement is genuine and recurring, so a high-single-digit net margin may prove sustainable rather than a one-year peak. What follows separates the durable supports from the borrowed ones: gross margin fell from 42.3% to 34.2% as a rising share of the work shifted to a related affiliate, while net margin rose only because financing cost and tax fell as a share of revenue — tailwinds that look temporary.
A divergence that points the wrong way
The headline is a widening gap between two margins that normally move together. Over FY2023–FY2025 revenue grew 90%, gross margin fell more than eleven points, and net margin drifted up.
Gross and net margin computed from consolidated revenue, cost of revenues and net profit: FY2025 and FY2024 from the FY2025 statement of profit or loss [3]; FY2023 from the FY2024 statement [4].
The obvious suspect — a shift in mix toward the low-margin Karoseri body-building unit — is not the answer. Karoseri revenue did grow faster than the group, from Rp22.7bn to Rp71.3bn, but its own gross margin improved sharply, from 8.2% to 28.3%, so it lifted the blend rather than dragging it [5]. The compression sits entirely in the Land Transportation segment, which is 89% of revenue: its gross margin fell from 44.2% to 34.9% in a single year [6].
The gross margin went into bought-in haulage
The cost-of-revenues note splits the trucking cost base into two kinds of cost: haulage bought in from other operators, and the running cost of the fleet Graha Trans owns — depreciation, tyres, spare parts, insurance. The two moved in opposite directions relative to revenue.
Bought-in haulage ("Transportation expense") and owned-fleet running cost (depreciation, spare parts, insurance, tyres, other) from Note 25, divided by Land Transportation segment revenue of Rp585.0bn (2025) and Rp406.2bn (2024) [7].
Bought-in haulage rose from Rp163.8bn to Rp296.9bn — up 81% against 44% revenue growth — so it climbed from 40% to 51% of segment revenue [8]. The owned-fleet running cost — Rp62.8bn rising to Rp84.0bn — grew 34%, slower than revenue, and held near 15% of segment sales in both years [9]. The whole 9.3-point fall in Land Transportation gross margin is the bought-in line: the company's own trucks remained as efficient as before, but a growing share of the freight is being fulfilled with hired-in capacity carried at a much thinner spread.
The capacity is hired from an affiliate
That hired-in capacity is not an arm's-length spot market. Purchases from related parties reached Rp249.6bn in FY2025 — 38.0% of consolidated revenue and 57.8% of the total cost of revenues, against just Rp36.6bn (8.5% of revenue) a year earlier [10]. That figure is about 84% of the Rp296.9bn bought-in haulage line, so the growth in subcontracted freight is overwhelmingly one affiliated supplier — the common-control counterparty examined in Related-Party Flows. In two years Graha Trans has moved from running the trucks that carry its freight to routing the majority of new volume through a related operator and booking the margin that is left.
This is the mechanical reconciliation of the divergence the report has carried since Growth on Borrowed Money: the business is not losing pricing power on its own fleet so much as re-routing growth through a thin-spread, asset-light, related-party channel. It has a defensible logic — it lets the company serve a surging e-commerce customer without buying and financing ever more trucks — but it means reported gross profit increasingly reflects a markup on an affiliate's invoice rather than the economics of an owned asset.
Why net margin rose anyway
If gross margin fell eight points at the group level, net margin could only rise because everything below gross profit fell faster still. It did.
Each line as a share of consolidated revenue; effective tax rate is tax expense over pre-tax profit. Administrative overhead from Note 26, financing cost is finance charges plus musyarakah financing cost, tax and pre-tax profit from the statement of profit or loss [11] [12]; FY2023 from the FY2024 statement [13].
Two of the three helpers are ordinary. Administrative overhead fell from 12.9% to 10.4% of revenue — genuine operating leverage on a fixed cost base [14]. The effective tax rate dropped from 30.1% to 23.8% [15]. The third is the anomaly. Total financing cost — finance charges plus musyarakah cost — fell from Rp69.9bn to Rp65.1bn even though interest-bearing debt rose roughly Rp150bn over the year, to about Rp728bn, as traced in Financing the Fleet. Financing dropped from 16.3% of revenue to 9.9% while the debt it services grew by a quarter.
The reconciling item is timing. Note 33 records Rp240.8bn of trucks acquired during FY2025 through new consumer-financing (Rp193.3bn) and bank debt (Rp47.5bn) [16], while consumer-financing interest itself fell from Rp41.6bn to Rp29.8bn as older, higher-cost leases ran down [17]. Much of the new stack was added late enough that only a partial year of its interest reached the FY2025 income statement. Even at a low-double-digit borrowing rate, a full year on Rp240.8bn of fresh debt is on the order of Rp25bn to Rp29bn of financing cost — a quarter or more of the Rp90.9bn pre-tax profit — before any offset from continued amortisation of the older leases. The FY2025 financing ratio is more likely a trough than a new normal.
Durability of the ten-percent margin
The net margin therefore leans on two supports the gross-margin trend does not: a financing ratio that looks set to rise, and an affiliate haulage bill whose pricing the company itself flags as not independently established. Both make the ~10% margin sensitive in the direction of lower, not higher.
The affiliate exposure is straightforward arithmetic. On Rp249.6bn of related-party purchases, a 5% increase in the rate the affiliate charges would cost Rp12.5bn — 13.7% of FY2025 pre-tax profit; a 10% increase would cost Rp25.0bn, or 27.5% [18]. Because the counterparty is under common control, the split of margin between Graha Trans and the affiliate is a decision made inside the ownership group rather than by a market, and the earnings base is only as durable as that decision.
Bought-in haulage growth
Owned-fleet cost growth
Affiliate share of haulage
Pre-tax hit if affiliate +10%
FY2024–FY2025 growth in bought-in haulage and owned-fleet running cost, affiliate purchases as a share of the bought-in line, and the pre-tax profit impact of a 10% rise in affiliate haulage rates, all from Note 25 [19] [20].
The fair reading of the other side: none of this has yet reduced profit in absolute terms. Gross profit still grew 23.6% in FY2025, to Rp224.3bn, and net profit grew 75% [21]. An asset-light model that hires capacity instead of buying trucks is genuinely capital-efficient: it is the company's most capital-efficient route to keep serving its largest customer without the additional lease debt the balance sheet can least afford. If the affiliate haulage is priced fairly and the financing normalisation is modest, a high-single-digit net margin on fast-growing revenue is a perfectly reasonable base case — and the owned fleet, the part the company controls, is running at a stable cost ratio.
What would settle it is close at hand. The FY2025 pattern — gross margin down, net margin up on falling financing cost — should reverse first at the gross line and then at the net line as the new debt seasons. The Q1 FY2026 run-rate discussed in Valuation and Estimates already shows net margin easing toward 10% and gross margin lower year on year, the first data point in that direction. A H1 FY2026 print on 4 August 2026 that holds net margin near 10.5% with gross margin stabilising above 34% would say the bought-in model is accretive and the earnings more durable than this chapter treats them; a gross margin below 33% with net margin under 9% would confirm that FY2025 borrowed its net margin from below the operating line.
Graha Trans operates in a genuinely large, growing market — Indonesian road freight, roughly US$54 billion and compounding at mid-single digits on FMCG and e-commerce demand. But it is a fragmented, spot-priced business that confers little pricing power: gross margin fell from 45.7% to 34.2% even as revenue nearly doubled. GTRA is a scale leader among listed peers yet a rounding error in the market, and its outgrowth came from winning two customers, not from the market's rise.
A large market, and a real tailwind
The demand backdrop is the strongest part of the story, and it is not a company claim — it is where the Indonesian economy has actually been. National GDP grew 5.03% in 2024 to a nominal Rp22,139.0 trillion, with per-capita income of about US$4,960 and inflation held to 1.57% [1]. Inside that, transportation and warehousing has been the fastest-growing sector of the economy: per the national statistics agency (BPS), it expanded 13.96% in 2023 — the highest of any industry — and contributed 5.89% of GDP [2]. Looking forward, Supply Chain Indonesia projected the sector would contribute Rp1,623.65 trillion to GDP in 2025, up 12.53% year-on-year [3], with manufacturing PMI holding in expansion above 51.2 [4].
Independent market research points the same way. Mordor Intelligence sizes Indonesian road-freight transport at about US$53.9 billion in 2025, growing to roughly US$76 billion by 2031 (a ~5.7% CAGR), with road accounting for ~62% of the freight and logistics market. The same work notes that national logistics costs run near 24% of GDP — a structural inefficiency the government has targeted to bring toward 8% by 2045, which is the policy tailwind behind fleet modernisation and formalisation.
Road-freight market, 2025 (est.)
Forecast CAGR to 2031
GTRA revenue as share of market
Market size, CAGR and road-freight share from Mordor Intelligence's Indonesia road-freight transport report (external, non-corpus). GTRA share derived from FY2025 revenue of Rp656.3 billion (~US$39m at year-end FX) [5].
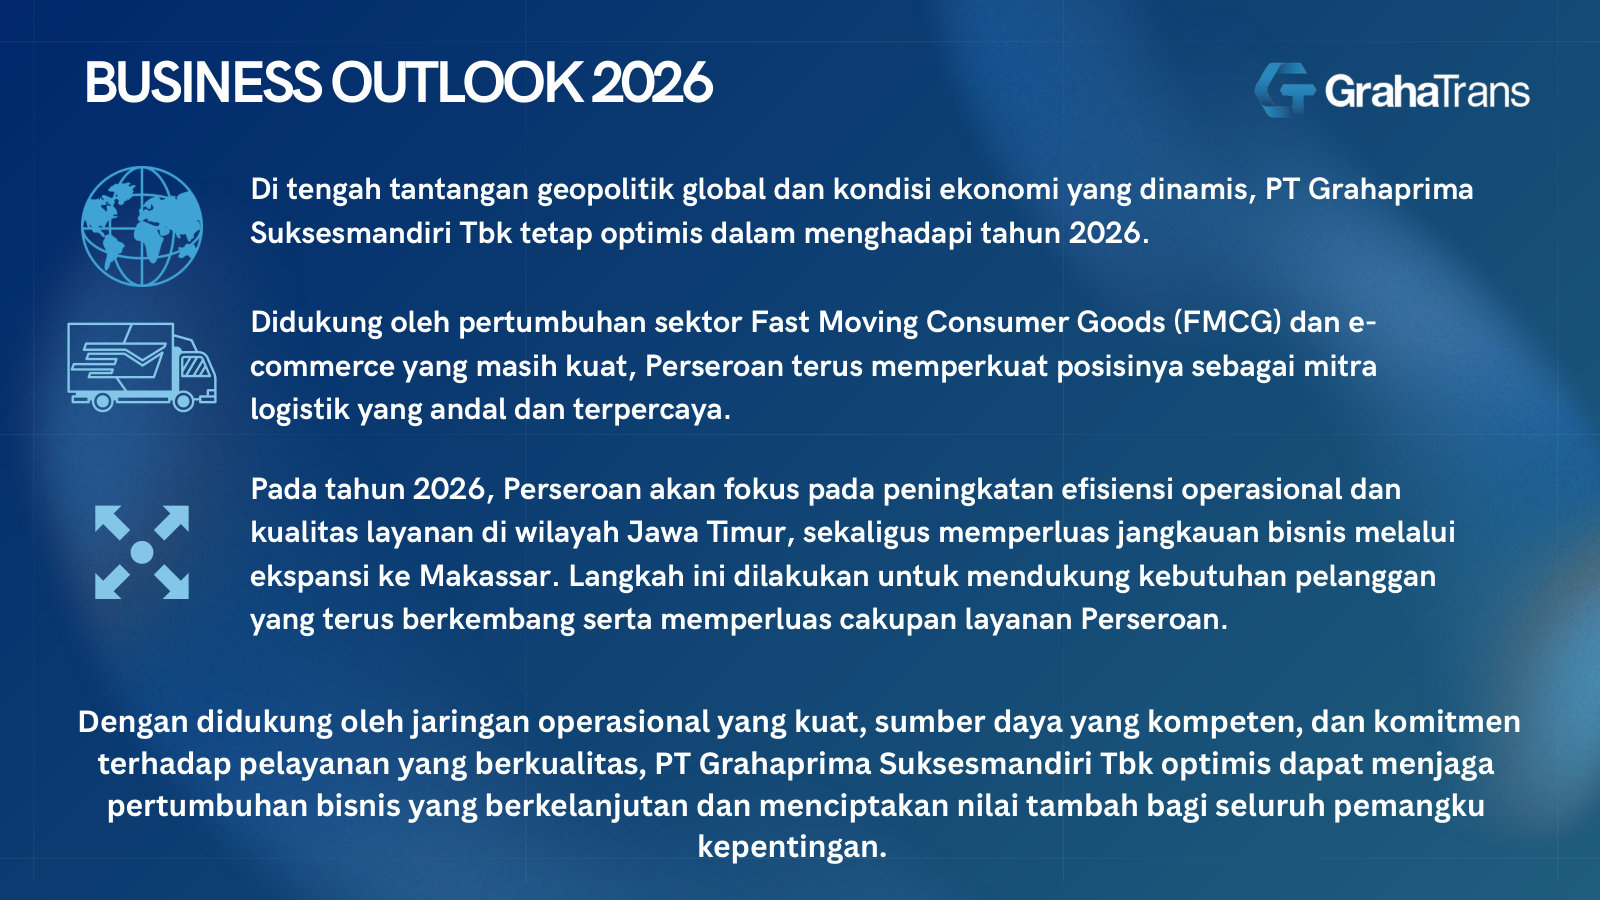
Management's own read of the tailwind is narrower and, usefully, more specific: it attributes the outlook to continued strength in FMCG and e-commerce, and is expanding operationally into East Java and Makassar to chase it [6]. That is consistent with the demand base Two Customers established: Shopee-driven parcels and Mayora staples freight are the visible edge of the e-commerce and consumer-goods growth the macro data describes.
A fragmented, price-taking market
A large, growing pond is not the same as a good business, and the road-freight market's defining feature cuts against returns rather than for them: it is deeply fragmented. Industry research finds that roughly two-thirds of Indonesian expedition and courier firms earn under Rp2 billion a year, and that small operators compete largely on spot pricing rather than route optimisation or service. In a market where thousands of sub-scale carriers price truck-by-truck, no single operator sets the price — they take it.
Graha Trans's own top line carries that signature: over two years revenue rose from Rp344.9 billion to Rp656.3 billion — up 90% — the pattern of a volume-taker winning share, not a price-setter holding rates. Gross margin fell over the same span, from 45.7% to 34.2% [7], but that decline is a cost-mix mechanic rather than a pricing verdict — The Margin Math decomposes it as the shift into bought-in affiliate haulage with owned-fleet cost held roughly flat.
Revenue and gross profit from the FY2025 Annual Report's three-year income statement; margin is gross profit ÷ revenue [8].
Where Graha Trans sits
Against the total market, GTRA is tiny: FY2025 revenue of about US$39 million is roughly 0.07% of the road-freight pond. But against the handful of listed pure-play truckers it competes with on the IDX, it is comfortably the largest. The peer set — Guna Timur Raya, Sidomulyo Selaras, Batavia Prosperindo Trans, Jasa Berdikari Logistics, MPX Logistics and Trimitra Trans Persada — are all small-cap Indonesian land-transport operators [9]. The one with disclosed comparable financials, Sidomulyo Selaras, is instructive: its FY2025 net revenue was Rp77.16 billion — down 18.7% on the year, with 99% from transport services [10] — on a gross profit of Rp24.29 billion, a ~31% margin [11]. Graha Trans is roughly 8.5 times its revenue and growing while that peer shrinks.
GTRA figures from the FY2025 Annual Report income statement [12]; SDMU from its FY2025 Annual Report [13][14]. The other four listed peers do not disclose comparable financials in the corpus.
What edge GTRA has is operational, not structural. It runs about 1,210 trucks, dominated by Full-Truck-Load units, from pools across Java, Bali and Sumatra [15], and markets a modern, well-maintained Euro-4 Hino fleet as the differentiator in a market full of older equipment [16]. Those are real advantages — scale, fleet quality, a dedicated-fleet service model — but they are advantages any well-capitalised operator can replicate. They lower cost and win contracts; they do not lock customers in or set prices. One caveat on the fleet: the "1,210 units" figure is repeated verbatim in the FY2023, FY2024 and FY2025 reports [17], so the corpus does not actually support a year-by-year fleet count — documented capacity looks broadly flat near 1,210 while revenue nearly doubled, which means the growth came from utilisation, rates and the rental model rather than a disclosed expansion of the truck count.
The growth wasn't the tide
The tailwind is genuine, and it lowers the demand-side bankruptcy risk: the pond is large, structurally growing, and driven by the same FMCG and e-commerce flows GTRA serves, so the business is not fighting a shrinking market. But the tailwind did not produce GTRA's numbers. Two Customers showed that essentially all of the two-year revenue increase came from two accounts; the market growing at ~13% a year did not lift GTRA's book by 90% — winning Shopee Express's dedicated-fleet work did. The industry explains the demand for trucks; it does not explain the returns on them.
The competitive read turns on two separate questions. On demand durability, the tailwind is a genuine support and the market structure poses little bankruptcy risk from a collapse in freight volumes. On economics, the same fragmentation that makes the market large makes it a price-taker's market: GTRA has scale and a good fleet but no moat that defends pricing, and its outgrowth of the industry was customer-specific and therefore only as durable as those contracts. What would change this read is evidence of pricing power the numbers don't yet show — gross margin stabilising or rising while volume grows, or a shift toward contracted, differentiated work that the spot market cannot underbid. Until then, the large, growing market is a reason the business exists, not a reason its returns are safe.
Valuation and Estimates
At Rp242, Graha Trans trades at 6.6x trailing earnings and 1.19x book — statistically cheap for a business that grew net profit 75% in FY2025 and 13% in the first quarter of FY2026. Two facts complicate the screen. No sell-side analyst covers the stock, so there is no forward consensus to anchor to; and the 6.6x equity multiple sits on a thin slice of a balance sheet levered nearly two-to-one, so on enterprise value the same business costs about 7.5x operating profit — an ordinary price, not a distressed one.
The multiples today
Trailing P/E
Price / Book
EV / EBIT
Dividend Yield
Multiples computed at the 31 Jul 2026 close of Rp242 (Yahoo Finance / IDX) on 1,894,375,000 shares, FY2025 EPS of Rp36.48 and equity of Rp386.3bn [1]; FY2025 EBIT and net debt per the consolidated statements [2].
The share count is fixed: 1,894,375,000 shares — the 1,515,500,000 held before the March 2023 IPO plus the 378,875,000 sold to the public [3]. At Rp242 that is a Rp458bn market capitalisation. FY2025 net profit attributable to owners was Rp69.1bn and basic EPS Rp36.48 [4], which sets the trailing P/E at 6.6x. Book value per share is Rp204 against equity of Rp386.3bn attributable to the parent [5], a 1.19x price-to-book.
The dividend is not part of the case. The company paid Rp1.82 per share on FY2024 earnings, a total of Rp3.45bn [6] — a payout near 9% of that year's profit and a yield of 0.8% at the current price. No FY2025 dividend has been declared in the corpus. The public float is 20% of the equity, roughly Rp92bn of market value, and the stock has no research coverage — a combination that leaves pricing thin and episodic.
Recent trading shows that thinness. The shares reached Rp378 on 19 February 2026, fell to a Rp161 low on 8 June — a 57% drawdown — then recovered to Rp242, still 36% below the February high and well above the Rp150 IPO price of March 2023 [7].
Source: month-end daily closing prices, Yahoo Finance / IDX (Feb–Jul 2026); intra-period high Rp378 (19 Feb), low Rp161 (8 Jun).
The equity multiple flatters the balance sheet
A 6.6x P/E reads as cheap, but earnings accrue to equity that funds only a minority of the assets. Interest-bearing debt at year-end was Rp727.9bn — short-term bank loans, bank term loans, consumer (finance-lease) financing and musyarakah financing — against Rp19.7bn of cash [8]. Adding Rp708bn of net debt to the Rp458bn market capitalisation gives an enterprise value near Rp1,167bn.
Net debt = Rp727.9bn interest-bearing debt less Rp19.7bn cash [9]; market cap at Rp242 × 1,894,375,000 shares.
On that enterprise value the multiples are unremarkable. FY2025 operating profit (gross profit of Rp224.3bn less general and administrative expense of Rp68.1bn) was Rp156.0bn [10], putting EV/EBIT at 7.5x. Adding back Rp44.8bn of depreciation [11] gives EBITDA of Rp200.8bn and EV/EBITDA of 5.8x. The gap between the 6.6x P/E and the 7.5x EV/EBIT is the leverage: the equity is a geared claim on the enterprise, which is why a fall in operating profit would hit the share price harder than the headline multiple suggests, and a rise would help it more.
Sources: FY2025 income statement and equity [12]; EPS, share count and dividend [13]; depreciation [14]; Q1 FY2026 profit [15].
Forward estimates: no consensus, one hard data point
The reader's standing request for forward estimates runs into a plain fact: GTRA has no sell-side coverage. Zero analysts publish estimates or price targets; Simply Wall St, stockanalysis.com and Yahoo Finance all show research fields as not available. There is no consensus revenue, EPS or target price to report, and none should be manufactured. What exists is management's own commentary and the most recent quarter.
Management's forward guidance is qualitative and unquantified. The June 2026 Public Expose frames 2026 around continued FMCG and e-commerce demand, operational-efficiency gains in East Java, and geographic expansion into Makassar — with no revenue or profit target attached [16]. Where management has put a number to the future, its record argues for caution in either direction: guidance for FY2025 revenue was around Rp500bn, and the company delivered Rp656bn — a 31% overshoot [17]. The Shopee Express ramp that drove that beat (covered in Two Customers) is not a base management had modelled, so its own targets are a weak planning anchor.
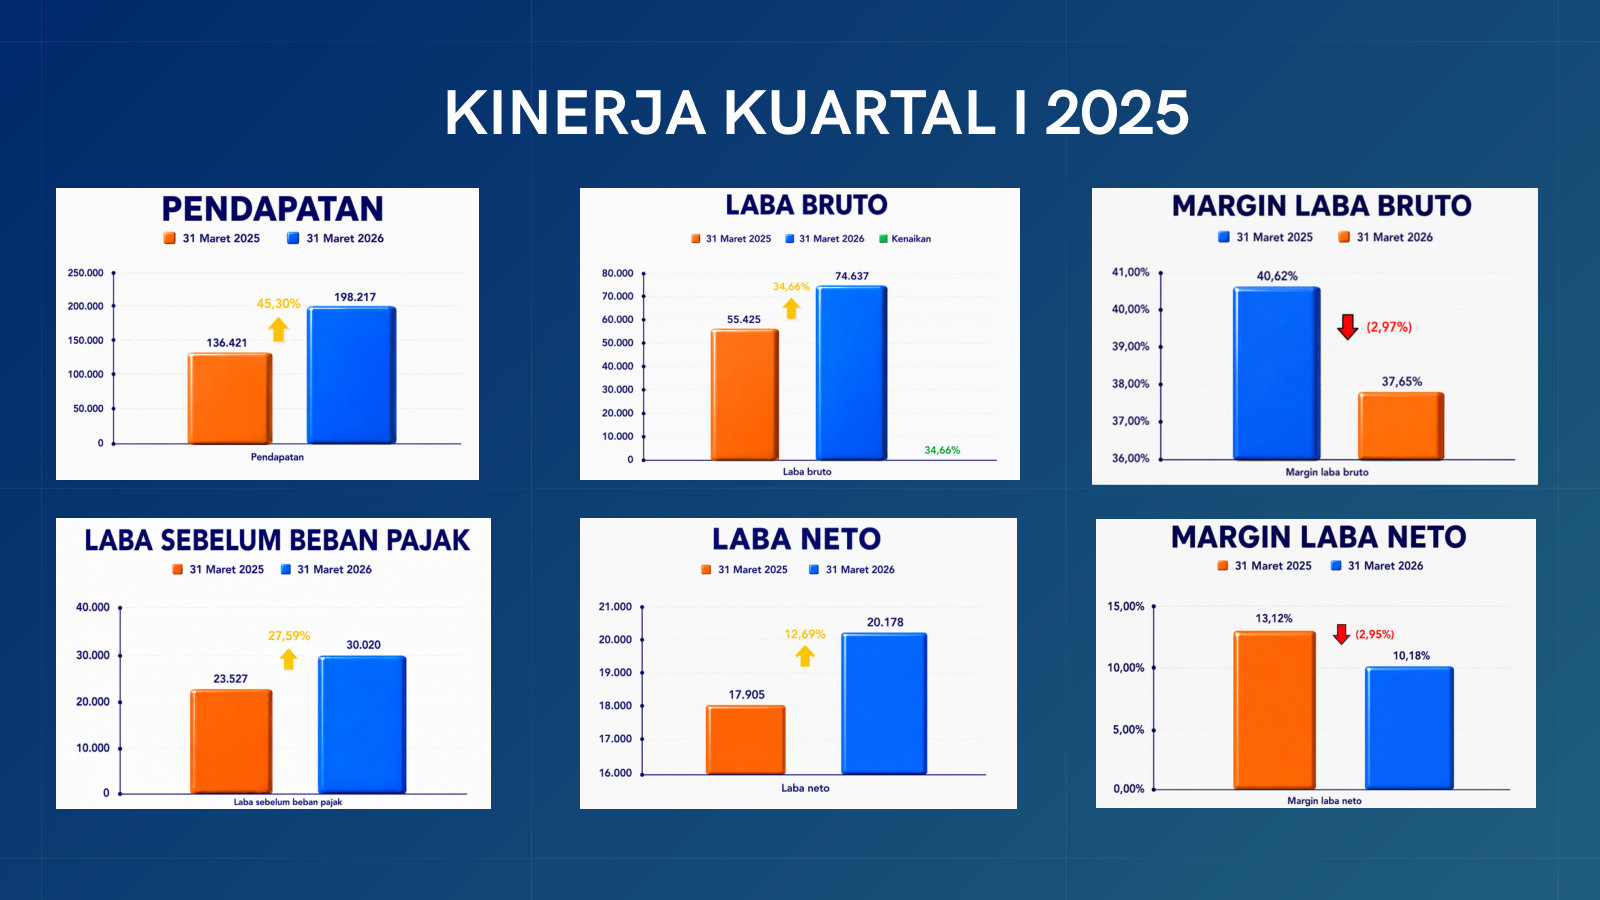
The one quantitative forward signal is the first quarter of FY2026, reported in the same deck. Revenue rose 45% year on year, but profit growth was far slower and margins compressed.
Source: Public Expose, 18 Jun 2026, Q1 FY2026 vs Q1 FY2025 [18].
Net profit grew 13% on 45% more revenue because the net margin fell to 10.2% from 13.1% a year earlier, and gross margin slipped to 37.7% from 40.6% [19]. That extends the gross-margin erosion traced in Market and Moat: volume is still compounding, but each rupiah of revenue converts to less profit as bought-in haulage capacity carries the growth. Quarterly EPS was Rp10.60 [20]. Annualising that at the seasonal weight Q1 carried in FY2025 (about 26% of the full year) points to FY2026 EPS near Rp41 and net profit near Rp79bn — a single-quarter extrapolation, not an estimate, and one that assumes the margin does not slip further. On that run-rate the forward P/E is roughly 5.9x. The next audited print is due 4 August 2026.
What the multiples price in
Holding FY2026 earnings at the Q1 run-rate (~Rp41 of EPS), the current Rp242 sits just under 6x forward earnings. The table below shows the price implied by a range of exit multiples against that figure.
Implied price = FY2026e EPS of Rp41 (annualised Q1 FY2026) × exit multiple; current price Rp242 (31 Jul 2026, Yahoo Finance / IDX).
At a low-double-digit multiple — ordinary for a growing logistics operator — the shares would roughly double; even holding the multiple flat, growth alone lifts the value. Much of that upside comes from the low starting multiple rather than growth alone, so what the discount prices in is worth stating precisely. Four things sit inside the 6x forward multiple, each documented in earlier chapters. Revenue is concentrated in two customers on one-year rolling contracts, one of them 41% of the top line (Two Customers). Margins are compressing as related-party haulage replaces owned-fleet capacity, and the Q1 FY2026 print shows that compression continuing (Market and Moat). The balance sheet carries Rp728bn of interest-bearing debt against Rp7bn of cash net of a new overdraft, with rollover a live question (Financing the Fleet). And a governance discount attaches to the Rp245bn of affiliate purchases and the Rp25bn advanced to the parent (Related-Party Flows).
Margin is the swing factor among the four. GTRA's net margin rose from 9.2% to 10.6% in FY2025 even as gross margin fell 8 points to 34.2% (related-party bought-in haulage reaching Rp249.6bn, 57.8% of cost of revenue) only because financing cost fell to a 9.9%-of-revenue trough, yet Rp240.8bn of new debt-funded fixed assets added late in the year carry ~Rp25-29bn of annual interest (28-32% of pre-tax profit) and a 10% affiliate-haulage repricing would cost Rp25.0bn (27.5%) — so the offset that holds the margin up is itself about to erode (The Margin Math).
Against those, the value case is not thin. The stock changes hands near book value on a fleet that has recycled through the market at a gain — FY2025 proceeds from disposing of used trucks were Rp97.1bn [21], which argues the Rp204 of book value understates rather than overstates realisable asset value, and gives the 1.19x price-to-book an asset floor. The owner holds 80% of the equity, so the depressed price is shared by the people who run the company. And the growth is real, not hoped-for: revenue up 45% in the latest quarter, on hard audited numbers.
The read that fits the evidence: GTRA is genuinely cheap on earnings and near an asset floor on book, but the discount is largely explained rather than mispriced — the market is paying under 6x forward earnings for concentration risk, visible margin compression, high leverage and related-party leakage, not overlooking a clean compounder. The strongest fact against that read is the forward arithmetic itself: at ~5.9x forward earnings with revenue still growing 45%, a re-rating needs only for the earnings to hold, not to accelerate. What would resolve it is the direction of margins and the related-party items over the next two prints — if the net margin stabilises around 10% and the parent loan is repaid on schedule in October 2026 rather than rolled or enlarged, the discount looks like neglect; if margins keep sliding and affiliate reliance deepens, it looks earned. How those pieces reconcile into a margin-of-safety view is the work left for the closing chapter.
The Asset Floor
The margin-of-safety case leans on a book-value floor of Rp204 a share. This chapter tests whether that floor is solid. It is real — the assets are genuine, insured, non-impaired trucks and land, carried under the cost model with no revaluation gloss. But the fleet is carried at roughly what it fetches when sold, not below it, and vehicles and land alike are pledged to the lenders. The equity's protection is an ordinary residual behind secured debt, not a deep-discount asset play.
The balance sheet is a pile of trucks and land
Graha Trans is, on the asset side, almost entirely fixed assets. Net fixed assets were Rp956.1bn at end-2025, up from Rp795.4bn a year earlier, and that single line is 77% of the Rp1,242.8bn balance sheet and 99.9% of all non-current assets — deferred tax and other long-term items together are under Rp0.8bn [1]. The rest is working capital: receivables, inventory, and Rp19.7bn of cash [2]. There is no goodwill and no intangible line of any size. What a buyer of the equity owns, in substance, is a fleet and some land.
Total assets (Rp bn)
Fixed assets, net (Rp bn)
Land, at cost (Rp bn)
Book equity (Rp bn)
Fixed assets net Rp956.1bn and total assets Rp1,242.8bn from the consolidated statement of financial position [3]; total equity Rp386.6bn (Rp386.3bn attributable to owners, Rp204/share on 1,894,375,000 shares) [4].
Within that net fixed-asset figure, three classes dominate the gross carrying cost: vehicles at Rp694.9bn (direct-ownership trucks, before the separately-held leased fleet), land at Rp181.9bn, and buildings and infrastructure at Rp61.7bn [5]. The fleet is the engine of the business Financing the Fleet analysed on the funding side; here the question is what it is worth.
How the fleet is carried, and why that matters
Two accounting choices decide whether the Rp204 of book is conservative or generous. First, the group uses the cost model, not revaluation — so nothing on the balance sheet has been marked up to appraisal value, and reported book carries no revaluation surplus that could reverse [6]. Second, trucks are depreciated on a units-of-production method over an estimated life of 300,000 to 900,000 kilometres, while buildings and equipment run straight-line and land is not depreciated at all [7].
Usage-based depreciation is the economically honest choice for a haulier: a truck's value falls with kilometres driven, not with the calendar, so the carrying value tracks wear rather than an arbitrary time schedule. The FY2025 depreciation charge was Rp44.8bn, most of it (Rp40.6bn) inside cost of revenues [8]. Management recorded no impairment indicators on any fixed asset at year-end, and the fleet is insured against all risks for Rp648.9bn — comfortably above its carrying value, which is the right direction for an asset a lender is relying on [9]. None of this is aggressive. If anything, the policy set biases carrying value toward realism.
The disposal test: carried at fair value, not below it
The strongest evidence on whether book value is a real number comes from what happens when Graha Trans actually sells trucks — and it sells a lot of them. In FY2025 it disposed of trucks that had originally cost Rp148.1bn and were only 35% depreciated (accumulated depreciation of Rp52.2bn), leaving a net book value of Rp95.9bn, and collected Rp97.1bn in proceeds [10]. The gain over book was Rp1.2bn — 1.3%. The prior year told the same story: Rp25.1bn of book sold for Rp26.1bn, a 4.0% gain [11].
Details of the sale of fixed assets, Note 8: original cost, accumulated depreciation, net book value and proceeds; gain over book is proceeds less net book value (1.3% in FY2025, 4.0% in FY2024) [12].
This cuts two ways, and both matter for the reader. The good news is that book value is not fiction: trucks realise essentially their carrying amount in an orderly market, so the depreciation schedule is neither too fast nor too slow, and the Rp204 of book is backed by assets that fetch about Rp204. The caution is the flip side of the same fact — the fleet is carried at fair value, not below it. Earlier chapters described the trucks as "recycling at a gain"; that is technically true, but the gain is one to four percent, an orderly-market spread, not a hidden discount waiting to be unlocked. There is no deep pool of understated fleet value here for an asset-play buyer to capture.
Two further details confirm the fleet is run tight rather than milked. Fully-depreciated assets still in use total only Rp5.2bn of gross cost — the company sells trucks while they still have book value rather than running them to zero and hiding value off the depreciation schedule [13]. And the churn is heavy: against Rp148.1bn of trucks sold at cost, Graha Trans bought Rp255.8bn of new vehicles, all from third parties [14] [15]. The fleet grew, but it is a treadmill: capital must keep going in to keep the asset base current.
Vehicle additions Rp255.8bn and original cost of vehicles disposed from Note 8; disposals are the Rp148.1bn cost line from the sale-of-fixed-assets table [16] [17].
Land at cost
If there is hidden value in the assets, it is the land. Rp181.9bn of land sits on the balance sheet at historical cost, never revalued and never depreciated [18] [19]. Indonesian land held for years is often carried well below market, so cost accounting could understate the true worth of these truck pools and yards — Rp181.9bn is nearly half of book equity, so even a modest appreciation would matter. But the honest position is that the corpus contains no independent appraisal, so this is a possibility, not a proven cushion; nothing in the filings lets the market value be pinned. Land is the asset line that could hold value above its carrying cost, and the disclosures do not quantify by how much.
The floor protects lenders first
The decisive limitation is who has first claim on all of this. Fixed assets — "vehicles and land" — are pledged as collateral for the bank loans, the long-term musyarakah financing and the financing payables [20]. The Rp956.1bn of fixed assets stands behind Rp856.3bn of total liabilities, of which the great majority is secured interest-bearing debt [21]. Book equity is the Rp386.6bn residual — 31% of assets — that remains after the lenders are made whole [22].
That ordering is why the "asset floor" comforts a bond more than a share. The 1.3% disposal premium was earned selling roadworthy trucks one at a time into a functioning used market; a forced sale of a whole pledged fleet by a lender enforcing security would not clear book, and the equity sits behind that security. For a reader whose first fear is a holding going to zero, the genuine protection against bankruptcy is not the asset cushion but the cash flow that services the debt — operating cash covering interest 2.4x, as Financing the Fleet set out. The trucks keep the lenders safe; it is the earnings that keep the equity safe.
What this means, and what would change it
Asset quality is genuinely decent: real, insured, third-party-bought, non-impaired trucks depreciated on a rational usage basis and carried at about what they realise, plus land at cost. So the Rp204 book value is a real going-concern floor, not an accounting mirage — which is worth something to a buyer paying 1.2x book Valuation and Estimates. But it is not the deep-discount asset play the profile prizes: the fleet holds no hidden markdown, the whole asset base is pledged ahead of the equity, and the one line that might understate value — land at cost — cannot be sized from the filings. The margin of safety in the assets is ordinary, not large.
Two things would change this read. A land appraisal materially above the Rp181.9bn carrying cost would convert an unquantified possibility into a genuine cushion and widen the floor. Conversely, a break in the FY2026 finance bill or the customer book that forced disposals under pressure would test whether trucks still fetch book when the seller is not a willing one — the first live read on that lands with the H1 FY2026 statements.
What to Watch
This chapter reconciles the report into three scenarios and a dated signpost list. Graha Trans is a cheap, founder-controlled, fast-growing micro-cap: at Rp242 it trades on roughly 6.6x trailing earnings and 1.2x book, near a Rp204 book-value floor backed by a truck fleet that recycles at a gain. Near-term insolvency risk is low — operating cash flow covered interest 2.4 times in FY2025 [1]. But the margin of safety is contingent on two annually-renewed customers, a related-party cost base, and a thin cash buffer. The next two reporting periods and three dated events settle most of the debate.
Share price (Rp)
Book value / share (Rp)
Net debt / equity
Interest cover (x)
Sources: price at 31 Jul 2026; book value from equity of Rp386.3bn on 1,894,375,000 shares [2]; net debt/equity from Note 31 p.263 [3]; interest cover from operating cash flow over cash interest p.196 [4].
Reconciling the two cases
Every load-bearing fact in this report reads two ways. The table below pairs each shared fact — a number, date, or filing item established in an earlier chapter — with the bull and bear interpretation and the evidence that would decide it. None of these is a matter of opinion about the number; the disagreement is about what the number will do next.
Sources: FY2025 five-year financial highlights p.7 [5]; debt-to-equity p.263 [6]; customer concentration p.255 [7]; related-party purchases p.256 [8]; parent loan p.251 [9].
The debate is not evenly balanced across the five rows. The valuation and margin rows turn on the same variable — whether the ~10% net margin is a run-rate or a peak — because the cheap multiple is only cheap if the earnings hold (The Margin Math, Valuation and Estimates). The leverage row is where the reader's stated fear of bankruptcy lives, and it reads more reassuringly than the headline: solvency runs on cash flow, not the Rp7bn cash balance, and the debt is secured against a fleet that sold for Rp97.1bn during FY2025 [10]. The customer and governance rows carry the genuine tail risk, and both resolve on dated events in the back half of 2026.
Three scenarios
The scenarios below are arithmetic, not forecasts: each pairs an earnings path with an exit multiple the market has plausibly assigned to a business like this, and reads off the implied share price. With no sell-side coverage, the anchors are the FY2025 result (net profit Rp69.3bn, EPS Rp36.6) and the Q1 FY2026 run-rate (net profit Rp20.2bn, implying roughly Rp40–43 of full-year EPS) [11]. The downside is bounded, but not fully, by a Rp204 book value per share that itself rests on the truck fleet.
Source: derived from the FY2025 result and Q1 FY2026 run-rate; exit multiples applied by the author. Current price Rp242 (31 Jul 2026); book value Rp204/share. FY2025 EPS and Q1 FY2026 EPS per the five-year highlights [12] and the 2026 Public Expose [13].
Source: as above; ranges are the product of the stated EPS path and exit multiple, not a target.
At Rp242 the market is priced between the bear and base cases — closer to a business whose earnings hold than one that loses its anchor customer. The range is most sensitive to a single pair of decisions outside GTRA's control: whether Shopee Express renews and at what rate, and whether the affiliate that now supplies most of the haulage (Both Sides of the Ledger) holds its pricing. A 10% repricing of that affiliate haulage alone is worth about Rp25bn, or 27.5% of FY2025 pre-tax profit — enough to move the read from base toward bear without any change in demand.
The book-value floor is the reason the bear case does not run to zero. Book value is Rp204 per share [14], the assets behind it are trucks that sold for more than their carrying value in FY2025, and the equity is not propped up by goodwill. For a reader who wants the chance of a permanent loss near zero, that floor — not the earnings multiple — is the load-bearing part of the margin of safety. Its weakness is that a market fearing the related-party structure can hold a levered micro-cap below book for a long time.
Signposts through 2026
The watch items below are falsifiable: each names the line item, the filing it appears in, and the threshold that would move the read. They are ordered by how soon they resolve. Three of them fall due within roughly ten weeks of this writing.
Sources: parent-loan maturity 7 Oct 2026 per Note 19 p.251 [15]; new debt-funded fleet and the 4 Feb 2026 Indomobil Finance lease of 90 vehicles p.268 [16]; renewal windows per Two Customers; Q1 FY2026 leading indicator p.16 [17].
Two of these deserve a closer look because the corpus lets us size them where earlier chapters could only flag them.
The financing stack is knowable, and it points to a rising finance bill. The bank facilities that fund the fleet run 84 months at 9% to 11% a year — the most recent facilities, from Bank Saqu and Bank Amar signed in September 2025, both price at 9.00% [18]. Each carries a negative-pledge covenant: the company may not take on new third-party credit that would impair its ability to pay the lender without written consent, and it has obtained waivers where needed [19]. Two things follow. First, the FY2025 finance ratio of 9.9% of revenue is a trough, because Rp240.8bn of new debt was added late in the year and a further 90-vehicle finance lease was signed with Indomobil Finance in February 2026 [20] — both carry a full year of ~9% interest in FY2026. Second, the covenant lattice is a constraint on the growth engine itself: the debt-funded fleet model (Financing the Fleet) needs continual lender consent to keep adding trucks.
The parent loan is the cleanest governance test in the report. On 8 October 2025 the company lent Rp25bn of its own cash to its ultimate parent at 9% a year, maturing on 7 October 2026, with interest waived to 31 December 2025 [21]. GTRA borrows at 9% to 11% and lent to the parent at 9%, so the loan earns nothing after funding cost. Repayment on schedule would retire the single largest specific concern a minority holder can name; a rollover or an increase would turn a one-off into a pattern. Because the maturity is dated and the receivable is a disclosed line item, the reader will know the answer within the year.
What would change the read
The evidence points to a business that is cheap for identifiable reasons rather than mispriced by neglect, with a hard asset floor that keeps the probability of a permanent loss low — the reader's stated first requirement. The strongest fact against that read is that the growth, the profit, and the cash that services the debt all now pass through parties the controlling family sits on both sides of, and the fairness of that affiliate pricing cannot be verified from the filings (Both Sides of the Ledger). What would move the read to the bear case is concrete and near: the half-year statements showing net margin slipping below 10% while the finance bill climbs, the Shopee Express line falling away, or the parent loan being rolled rather than repaid. What would move it toward the bull case is equally concrete: the two anchors renewing, margin stabilising as the Makassar and East Java expansion matures, and the Rp25bn returning from the parent on 7 October. The company has scheduled the tests; the next two prints supply the first answers.